
Trading Range Compression Patterns
Early Entry with Proper Confirmation
Spatial Pattern Recognition Skills™ are a technique and skill that needs to be continually improved as technical traders gain experience, and can read charts to interpret candlesticks and indicators with more sophisticated abilities. SPRS takes time to develop but is essential to a full-time career as a technical trader, regardless of the trading instrument and financial market the trader chooses to trade as well as the style of trading.
Facebook (NYSE: FB) is an excellent example for one of the more challenging sideways patterns. Technical traders need to learn the new sideways patterns, in addition to the ones taught in most technical analysis books and seminars.
The new sideways patterns have evolved and become part of the common patterns seen during sideways markets due to the increased use of Dark Pool Alternative Trading Systems ATS venues, of which Twilight Pools and other partially lit venues are currently becoming more popular.
High Frequency Traders HFTs are also a major factor in price momentum action. Smaller funds, foreign funds, and sovereign funds investing in US stocks also contribute their particular buying style, unique orders, and venues developed for the smaller funds manager as this group is growing exponentially.
Online Retail Brokers are also considered a Dark Pool by the Securities and Exchange Commission SEC as they are trading among each other, and then filling orders from their customers using their inventories rather than sending orders to the exchanges.
All of these changes to the market structure are ongoing and continue to shape, redefine, and alter the price patterns seen on techncial charts.
The chart example of FB below shows a classic Trading Range sideways pattern. It had inconsistent peaks aka highs and troughs aka lows during the Trading Range sideway pattern that started in August, and had a minor unconfirmed breakout in March.
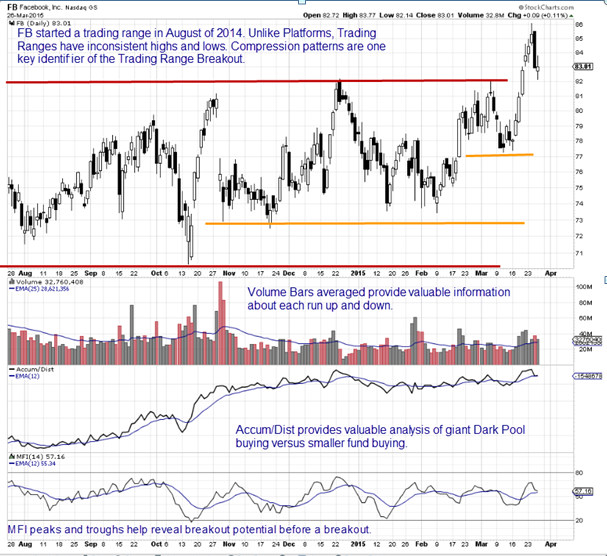 Technical traders need to be able to identify reversals, prior to the reversal commencing during a Trading Range as the highs and lows are inconsistent. Therefore the earlier an entry the more gains that can be made. Although MACD is the most commonly used momentum indicator, incorporating Volume and Quantity indicators improves the analysis substantially allowing for earlier entries. They also provide the ability to confirm whether the run will be a breakout or simply another intra-level run within the trading range. Volume and Quantity indicators also expose patterns that accompany compression of price, which is shown on the chart with the orange lines. As price compressed which is a common price action prior to a breakout, Volume and Quantity indicators confirm the compression has sufficient energy to break through the resistance highs of the Trading Range.
The FB chart example below is of the last momentum run in March, and shows that MACD and Bollinger Bands both give confirmation of the run.
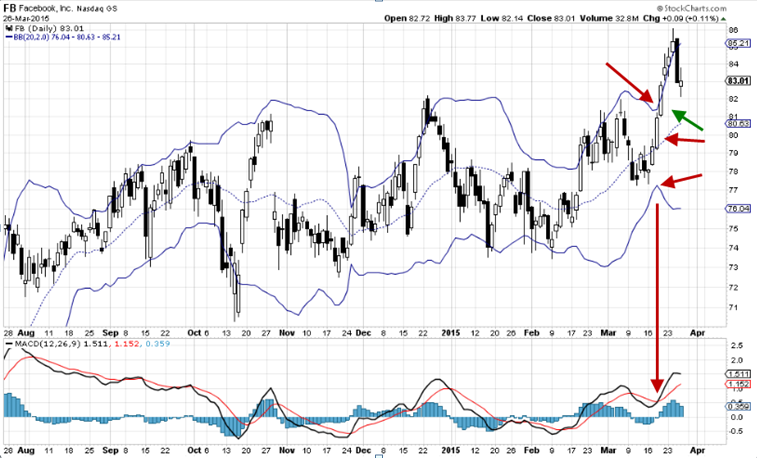 However, the run has already been underway for two days, before these Price and Time indicators signal an entry on the third day of the run.
Summary
To make the highest profits in one Trading Range run, the earliest possible entry must be made. Therefore indicators that confirm the strength of the compression pattern energy, help technical traders enter before or as the run begins rather than 2–3 days after the run started. This can have a huge impact on profitability for Swing and Day traders.
I invite you to visit my website at www.TechniTrader.Courses
Trade Wisely,
Martha Stokes CMT
Chartered Market Technician
Instructor & Developer of TechniTrader Stock & Option Courses
Copyright ©2017–2024 Decisions Unlimited, Inc. dba TechniTrader. All rights reserved.
TechniTrader is also a registered trademark of Decisions Unlimited, Inc.