
Tracking Institutional Investors
Quiet Accumulation/Distribution Indicators
The task of finding a simple reliable method for tracking the quiet accumulation of institutional investors in the stock market was no small feat for me many years ago. Market indicators track mostly indexes, advancing versus declining stocks, breadth, and so on which all basically track price action. But quiet accumulation is all about NOT moving price. So I created a scan that would give me a starting place for studying stocks with quiet accumulation patterns in the charts.
You can’t get this from only fundamentals, which are used by most trading systems to expose institutional activity. Fundamental data information about the company’s performance is usually updated every 3-4 months. Well, 3-4 months in the current market is ancient history. Huge accumulation or massive distribution can occur in that length of time. So all of those trading systems that claim to use fundamental accumulation/distribution are outdated modes of tracking the institutional investor activity. Fundamental accumulation/distribution can lag far behind. By the time it shows up quiet accumulation has become the speculative trading activity of short term institutional traders, with velocity action that offers scant support and Angles of Ascent™ that are too steep to sustain.
The TechniTrader Institutional Scan is one of my many scans that reveal quiet accumulation as it is going on. This scan will surge in numbers, drop in numbers, then rise again, and drop again. That is the cycle of quiet accumulation. The institutions are buying incrementally over time based on a specific price range of a stock. Quantities of shares accumulated are set, so as not to disturb a stock price. They often employ the liquidity Dark Pools, entering so that small and large intraday Day traders cannot see their huge order flow ticking off during the trading day. While they are delayed, their orders are still completely documented and become part of the overall market data seen in stock charts at the end of the day.
Dark Pools have been around for a long time, but only recently has the retail trader suddenly discovered them. The term Dark Pools refers to trading that goes on behind the scenes that is not shown on the Level II screens of Day traders aka exchanges public Limit Order books. What shows up are tiny orders for example of 100-500 share lots, offered out by a market maker. However behind the scenes, that market maker has an order for example of 500,000 shares of that stock. When the order hits at the target price range the 500,000 share order is triggered and filled in various ways, but always without causing price to rise. Dark Pools give giant institutional investors the efficiency of regular trading, with the ability to avoid exposing their intent to buy many shares of stock.
When you see a volume surge and little or no price movement, the underlying energy is caused by huge Pension and Mutual Funds that are the giant institutions moving in quietly using Dark Pools. So while all the news commentators and market gurus are scratching their heads wondering why a huge volume day didn’t cause stocks to move up, you know that quiet accumulation occurred. Accumulation/Distribution indicators can help you recognize the best early entries for stock and option trading.
Below is a candlestick chart example with the Balance of Power BOP indicator in the bottom chart window.
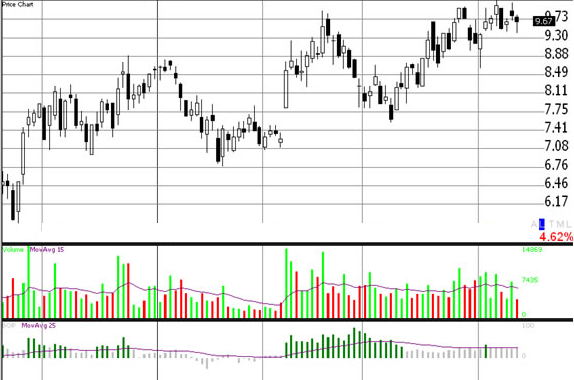 This stock chart is an example of quiet accumulation by institutional investors. Their activity is indicated in BOP by green bars for a short period of time followed by gray bars, then green bars again followed by gray. Along with the green to gray then gray to green bars, volume is above average much of the time as shown in the middle chart window. BOP is revealing quiet accumulation by institutional investors in stocks.
This is a powerful indicator because it is able to track the institutional investor accumulation/distribution when used alongside candlestick and volume patterns. By employing this cleverly constructed indicator into scans, we are able to expose end of day quiet accumulation activity over time.
Quiet accumulation/distribution by the giant funds doesn’t move price much, as their intent is to move into and out of stocks without moving price. They are savvy investors with massive amounts of money to move around. They buy incrementally over time and this pattern is exposed with Balance of Power and other indicators that expose large lot activity. You can use a scan to pick up stocks with basic accumulation patterns using accumulation/distribution indicators, and then study the charts with that indicator to find the quiet accumulation patterns of the institutional investors.
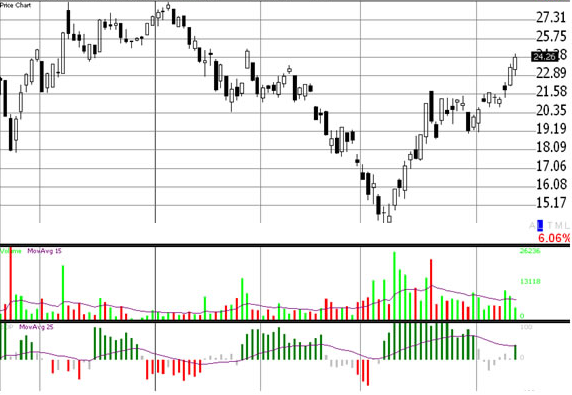
The next chart example below shows speculative short term large lot trading activity in the BOP indicator, buying and selling Day or Swing style. This is exposed by the back and forth between accumulation/distribution as indicated in the green then red bars in BOP. These are not institutional investors.
 Many retail traders only want a computer to find stocks for them to buy, and that is why so many make limited income from the stock market. Scans are a good way to narrow down the thousands of stocks in the market, to those that have the indications for large lot activity. Then the stock price and indicator patterns must be studied, for the best investing opportunities.
If a computer could do all the work of analysis, then there wouldn’t be any need for floor traders that cost market makers a ton of money on payrolls. People would not lose money in a Bear Market. Trading would all be done by computers, but it isn’t. That is because most of the patterns that are building strength for early entries require a human brain to recognize. That is your advantage over computerized High Frequency Trading HFT.
Getting to know quiet accumulation patterns with the help of a good scan, is the start of a great strategy.
Summary
When you first learn a new indicator you take in the most basic of levels, for BOP green means large lot buying and red means large lot selling. As you become more proficient at reading stock charts, go beyond green and red. Enter the more in-depth analysis where you study the patterns within the colors, the size and duration of the indicator bar patterns, and the relationship with volume and candlestick patterns. Over time your Spatial Pattern Recognition Skills evolve, and suddenly you will find yourself flipping through stock charts looking for good watchlist stocks at record speed.
I invite you to visit my website at www.TechniTrader.Courses
Trade Wisely,
Martha Stokes CMT
Chartered Market Technician
Instructor & Developer of TechniTrader Stock & Option Courses
Copyright ©2017–2024 Decisions Unlimited, Inc. dba TechniTrader. All rights reserved.
TechniTrader is also a registered trademark of Decisions Unlimited, Inc.