
Anatomy of a Stock Bottom
Candlestick Patterns and Large-Lot Indicators
Short-term bottoms are often a sideways pattern that slowly rises out of the low. Sometimes it is hard to see this as a bottom developing, because price is moving in such a choppy up and down pattern each day. One great way to decide whether a bottom is underway or not, is to use TechniTrader® Quiet Accumulation TTQA indicator to see if there is quiet accumulation underway by the Dark Pools.
The chart example below shows that a bottom is clearly underway when you study the TTQA indicator in relation to Volume bars.
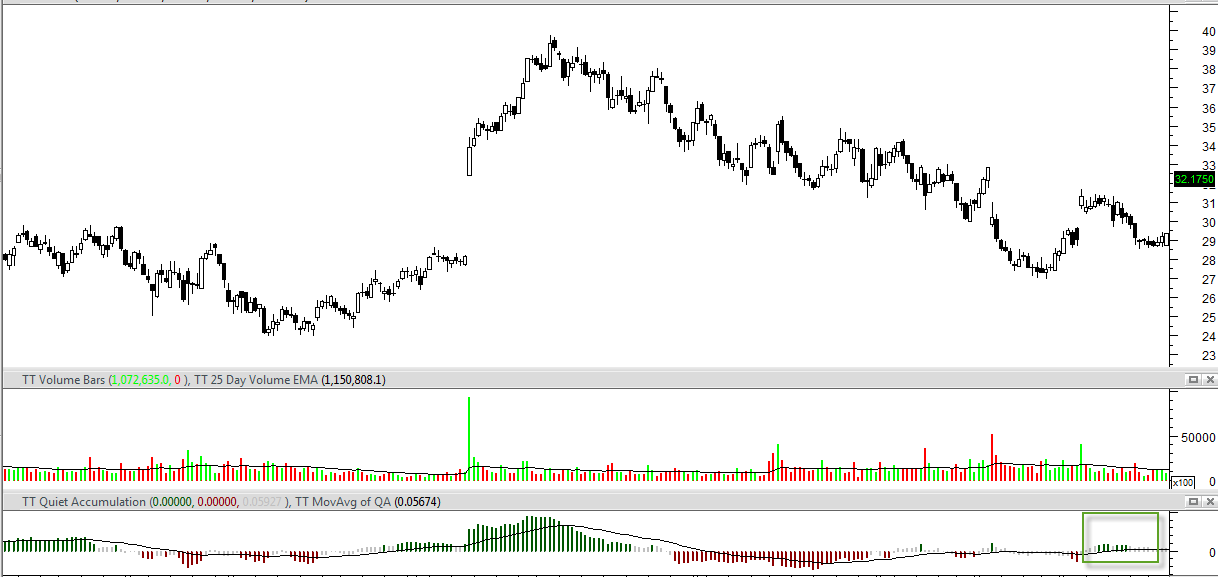 The top is defined by the High Frequency Traders HFTs trigger order, followed by many smaller funds rushing to buy. The combination of the green Volume spike to the top of the middle chart window and the heavy green TTQA in the bottom chart window, is the footprint of these Market Participant Groups. The small lots and smaller funds create the top as professionals start taking profits. As the stock falls into a correction, the red TTQA forms exposing selling short and some fund rotation. Then the stock starts what looks like another leg down; however, TTQA turns gray and green which is the footprint of the giant funds that use Dark Pools as outlined by the green box in the bottom chart window.
In the chart example below as the green TTQA forms, the stock makes a higher low and begins the process of building its bottom.
 This is an up and down action within a range of price. As long as price stays within that range, TTQA remains green and accumulation continues.
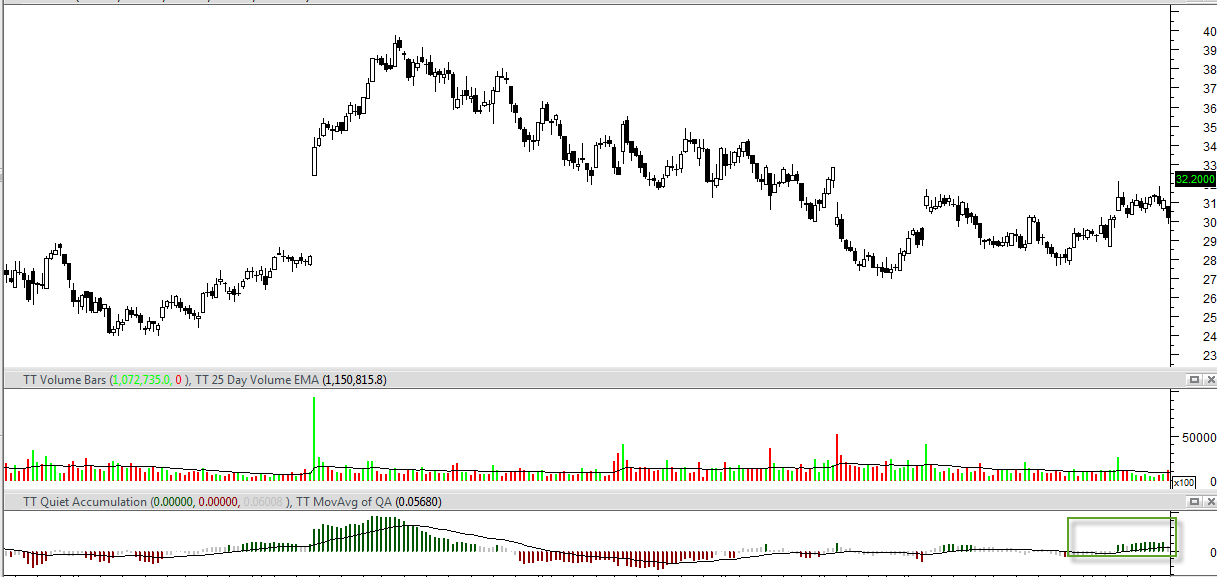
As shown in the next chart example below the accumulation continues for many days, and the stock slowly moves up.
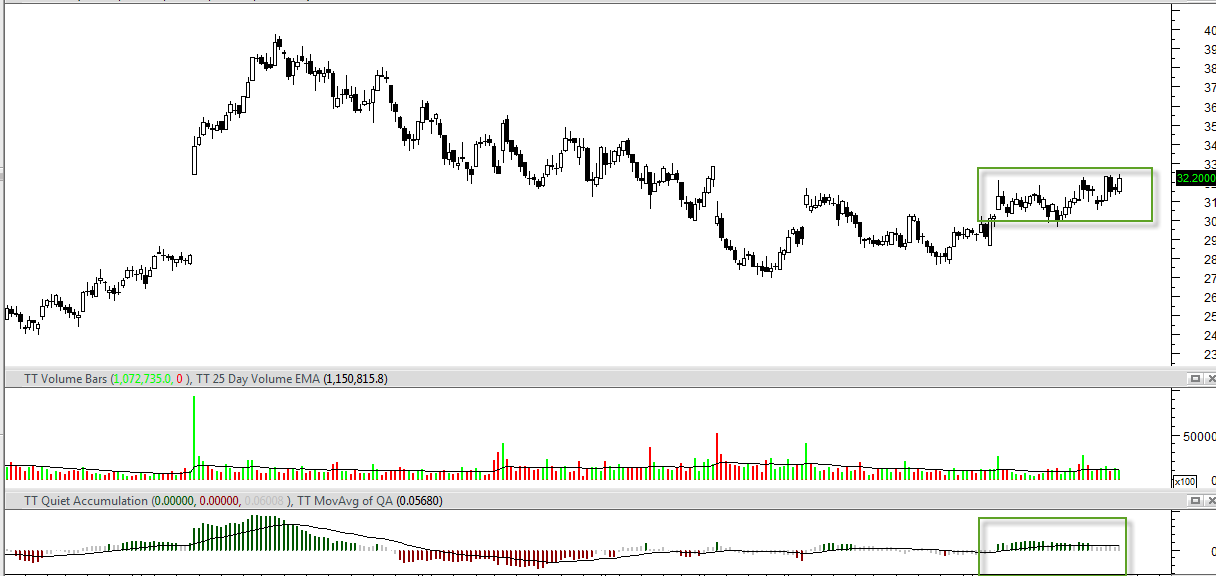 TTQA turns green as the price moves slightly out of the quiet accumulation zone. This is one of the most reliable patterns for determining when a stock has reached its bottom low, and is likely to start forming a true bottom.
Summary
Price will continue to move up and down during accumulation, because the giant institutions who are buying are quietly accumulating over time, and using a price range to do so.
Learning to identify bottoms early helps avoid whipsaw losses when selling short. It also helps the retail trader prepare to buy into the stock as it completes the bottom, and begins to accelerate with momentum energy.
I invite you to visit my website at www.TechniTrader.Courses
Trade Wisely,
Martha Stokes CMT
TechniTrader technical analysis using MetaStock charts, courtesy of Innovative Market Analysis, LLC dba MetaStock
Chartered Market Technician
Instructor & Developer of TechniTrader Stock & Option Courses
Copyright ©2017–2024 Decisions Unlimited, Inc. dba TechniTrader. All rights reserved.
TechniTrader is also a registered trademark of Decisions Unlimited, Inc.
Disclaimer: All statements, whether expressed verbally or in writing are the opinions of TechniTrader its instructors and or employees, and are not to be construed as anything more than an opinion. Readers are responsible for making their own choices and decisions regarding all purchases or sales of stocks or issues. TechniTrader is not a broker or an investment advisor; it is strictly an educational service.