
Why Use the TechniTrader® Quiet Accumulation (TTQA) Indicator?
Identify Dark Pools and High Frequency Traders
Reading MetaStock Charts is a skill that all traders need to hone and strive to improve constantly. Candlestick price patterns matter. What price is doing reveals a great deal about which Stock Market Participant Groups are controlling price.
Who is in control of price tells you the following:
- How price will behave
- How price will react to Support and Resistance
- How long price will move in that pattern
- What to look for ahead of sudden price moves
- When a top or bottom formation is underway
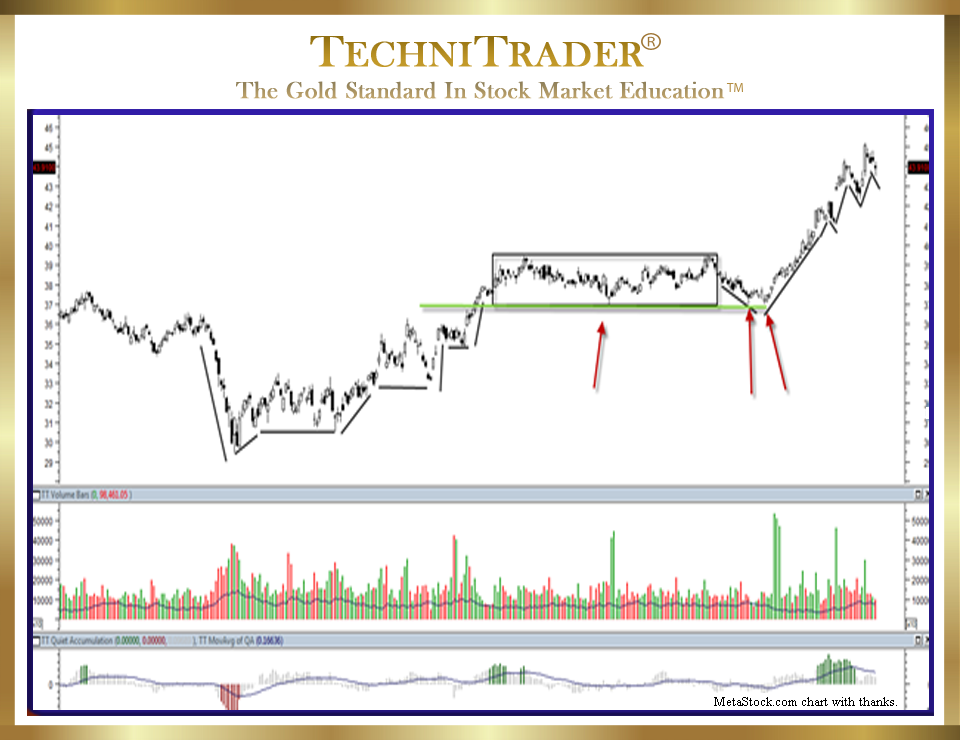
The chart example above shows an extreme Angle of Descent™ into the lowest low, as indicated by the first black line under price on the left side of the chart before a bottom commences. Even as this final sell down occurs, it is obvious that the steepness of the Angle of Descent is unsustainable. The TechniTrader Quiet Accumulation (TTQA) indicator in the bottom chart window is exposing Smaller Fund capitulation as the stock tumbles. The TechniTrader Quiet Accumulation indicator was developed by TechniTrader for MetaStock Users.
The Sideways Candlestick Pattern after the low is indicative of the giant Mutual and Pension Funds buying incrementally with Dark Pool controlled and bracketed orders over time. Since some Retail Traders and High Frequency Traders (HFTs) are still trying to Sell Short against the strength of the Giant Funds buying, the up and down day-to-day price pattern forms. This is underlined with the first black horizontal line on the left side of the chart.
Then, as the stock moves up to the first tier of resistance around $35–$37, the High Frequency Traders realize that Dark Pool buying by the Giant Funds has been going on. So, they rush to buy in quickly, creating a buzz in the Retail Trader world, and short-term Swing Trading occurs. At this time, the Giant Funds have accumulated what they wanted, and so the news spreads of their buying.
This creates speculative runs due to emotional at market buying by Smaller Funds. The stock runs up and then hits stronger resistance where it stalls. This price run action is underlined and is the last vertical line prior to the drawn box. Momentum evaporates and the stock moves sideways in a Platform Candlestick Pattern, as indicated by the box and underlined in green.
LEARN MORE at TechniTrader.Courses
Trade Wisely,
Martha Stokes CMT
TechniTrader technical analysis using a MetaStock chart, courtesy of Innovative Market Analysis, LLC dba MetaStock
Chartered Market Technician
Instructor & Developer of TechniTrader Stock & Option Courses
Copyright ©2017–2024 Decisions Unlimited, Inc. dba TechniTrader. All rights reserved.
TechniTrader is also a registered trademark of Decisions Unlimited, Inc.