
Relational Technical Analysis™ Reveals Hidden War on Wall Street
Buy Side Institutions vs. Sell Side Institutions
There is a hidden world within Wall Street that the average Retail Trader never sees or hears about. Right now, two powerhouse sides of the market are at war with each other. It is the Buy Side Institutions vs. the Sell Side Institutions. It is a battle for dominance in the financial world of the US. It often creates contrarian patterns within stock and index trends that can confound traders if they are unaware of what is going on behind the scenes. Relational Technical Analysis of stock charts can be applied to reveal these patterns.
Stock Chart Example Using Relational Technical Analysis
Stock charts show a conflict within the price action when compared to stock Volume Indicators that reflect who is dominating which side of the trade. This is a critical analysis we call “Relational Technical Analysis” for traders to use to understand what price patterns truly mean in terms of how stock values are likely to behave in the short term.
The stock chart example below shows such a pattern with price action:
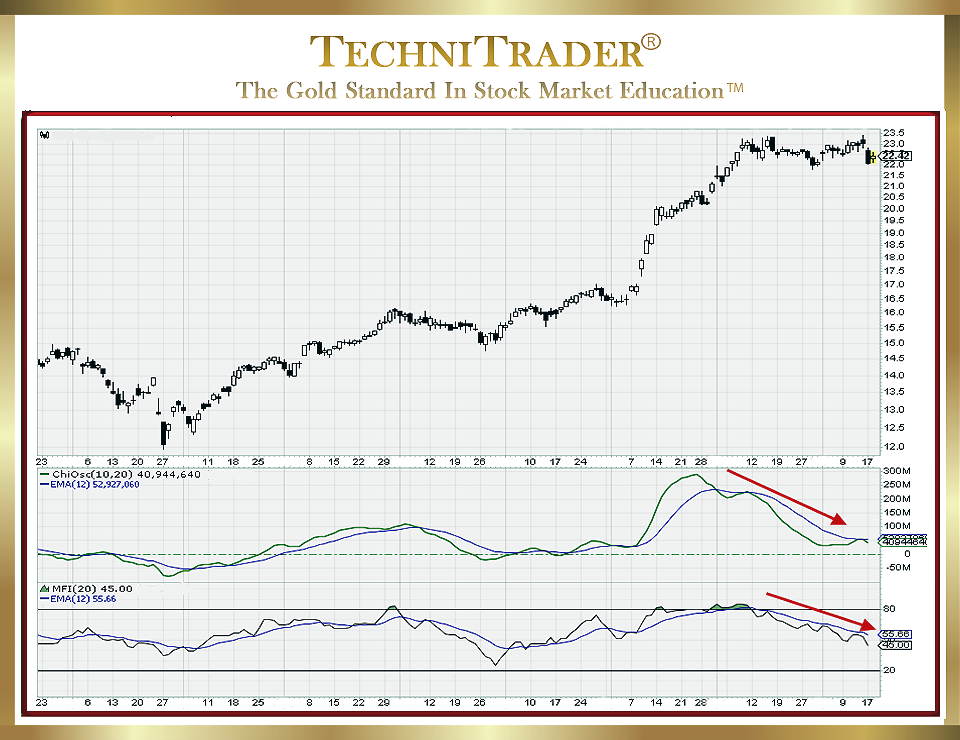
The stock chart example was in the news and rose on pure speculation of possible banking deregulations in the future. Although the average citizen may not understand that any deregulation will take at least a year if not several years to affect them, bank stocks skyrocketed into an extreme technical pattern that became unsustainable. During that run up, Buy Side Institutions started a steady Dark Pool Quiet Rotation™ out of bank stocks while banks were actually contributing to the runs via buybacks.
This stock chart example had scheduled a massive $5 billion buyback plan.
The sideways action shows a slow and steady Dark Pool Quiet Rotation out of this stock while the big bank buys back shares of its own stock. This is what helped it maintain a sideways candlestick pattern after an extremely speculative run up. There were several goals for maintaining the run, including convincing Retail Investors to buy stock.
“Wall Street” is not one entity but numerous distinctly different Stock Market Participant Groups that everyone knows as “the professional side of the market”. The most prominent and influential are the Buy Side Institutions and the Sell Side Institutions.
LEARN MORE at TechniTrader.Courses
Trade Wisely,
Martha Stokes CMT
TechniTrader technical analysis using a StockCharts chart, courtesy of StockCharts.com
Chartered Market Technician
Instructor & Developer of TechniTrader Stock & Option Courses
Copyright ©2017–2024 Decisions Unlimited, Inc. dba TechniTrader. All rights reserved.
TechniTrader is also a registered trademark of Decisions Unlimited, Inc.