
Why Use Bollinger Bands® %B for Swing Trade Entries?
To Customize Trading Style, Preferred Entry Signal, & Lower Entry Risk
Bollinger Bands are often used on the price chart itself, and they can be used on indicators as well. However, there are other indicators written by John Bollinger that give Swing and Day Traders an easier way to not only find strong momentum runs, but to also determine strength and run direction.
The chart example below shows the Peaks of %B that warn of profit taking on the short-term or daily trend, which is a reliable exit indicator signal. The chart also shows an extreme low indicating that the move down has ended and that the stock is going to head up after the consolidation.
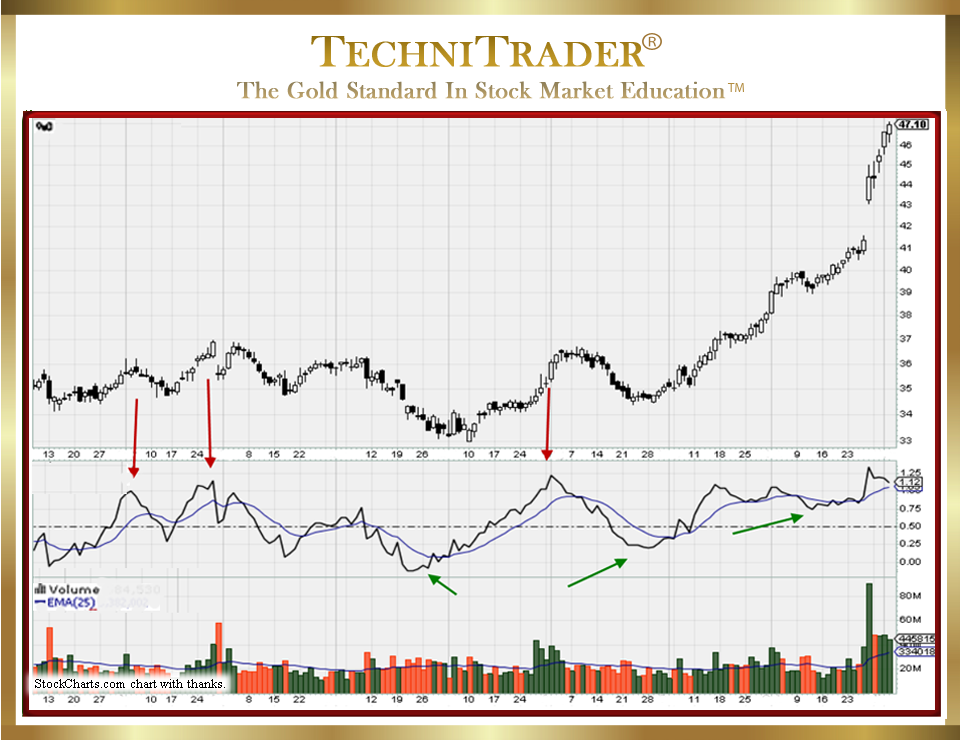
Even while price is compressing into the consolidation pattern on the chart, the %B clearly shows an upside energy building. The next higher low on %B indicates that more energy is building within the price action, and it precedes a strong momentum run that finally gaps.
By incorporating %B with your favorite Subordinate Indicator, you can customize your trading analysis for Swing or Day Trading and speed up your stock pick analysis process. %B is most reliable preceding momentum runs and is ideal for Bottoming Formation swing breakouts and strong runs. It is also very useful for Topping Formations before the stock breaks to the downside.
%B is one of the best indicators written by John Bollinger. If you are a fan of Bollinger Bands, you should add %B to your analysis, as it provides more information to guide you in your stock pick selections for Swing and Day Trading.
Using stock Volume and Quantity Indicators as well as Bollinger Bands is recommended, as all Bollinger Bands Indicators are price and time only. Including stock Volume, stock Volume Oscillators, Flow of Funds, or other Quantity-based Indicators will give you a complete set of data to analyze all aspects of the near-term price and stock volume action.
LEARN MORE at TechniTrader.Courses
Trade Wisely,
Martha Stokes CMT
TechniTrader technical analysis using a StockCharts chart, courtesy of StockCharts.com
Chartered Market Technician
Instructor & Developer of TechniTrader Stock & Option Courses
Copyright ©2017–2024 Decisions Unlimited, Inc. dba TechniTrader. All rights reserved.
TechniTrader is also a registered trademark of Decisions Unlimited, Inc.