
Dynamics of a High Frequency Trading Gap Down
List of Indicator Signals Reveals Dark Pool Quiet Rotation™
The stock chart example in this article has been under Dark Pool Quiet Rotation for over a year as Giant Funds quietly and slowly reduced the number of held shares in their portfolios using Dark Pools in expectation of a slowdown for this business. All businesses have an internal cycle.
Being able to identify when that cycle poses a high risk for a huge High Frequency Trading gap down is an important skill all Retail Traders and Technical Traders need to develop in order to recognize the dynamics of a High Frequency Trading gap down forming prior to the gap occurring.
The stock chart example shows an obvious pattern for a high risk of a High Frequency Trading gap down in several levels of analysis.
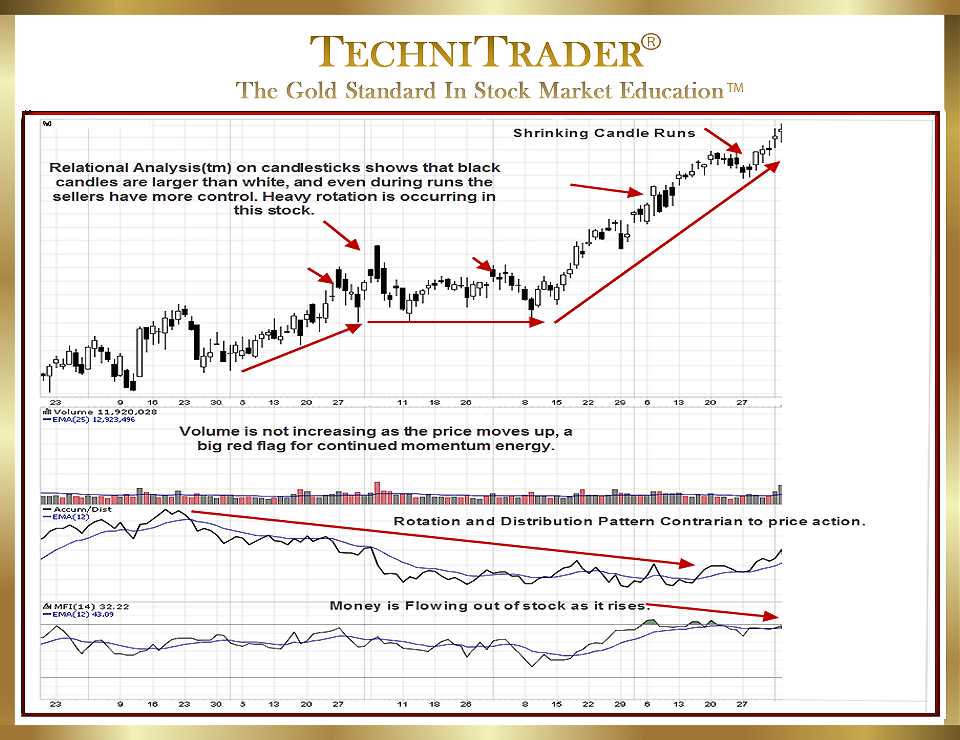
First of all, the stock started to lose the steady upside moderate uptrend, and the trend started shifting sideways with less upside momentum. Runs began to deteriorate faster. More and longer black candlesticks formed while white candlesticks became smaller and less consistent, until tiny indecision day candlesticks ended the uptrend prior to the 12-point gap down.
This was caused when High Frequency Traders (HFTs) triggered massive quantities of sell orders prior to market open on the company news of weaker Earnings. The Angle of Ascent™ for price was too severe to sustain, also warning of a high-risk gap down during Earnings Season.
LEARN MORE at TechniTrader.Courses
Trade Wisely,
Martha Stokes CMT
TechniTrader technical analysis using StockCharts charts, courtesy of StockCharts.com
Chartered Market Technician
Instructor & Developer of TechniTrader Stock & Option Courses
Copyright ©2017–2024 Decisions Unlimited, Inc. dba TechniTrader. All rights reserved.
TechniTrader is also a registered trademark of Decisions Unlimited, Inc.