
Why Use Inverted Technical Analysis™?
Determine If a Stock Is a Retracement or Sell Short
When Retail Traders are already in a stock and it starts to move down rather than up, many do not know whether to sell the stock or hold it. They are uncertain whether the move down is just a retracement or if the stock is going to continue moving down, so this is how Inverted Technical Analysis can help. What this means is that you are studying the downside action as if you intended to sell the stock short. If you are only looking at it from the standpoint that you are in a trade that is either slightly in profit or slightly at a loss, you will not know whether to sell the stock or hold it.
We are going to use the candlestick charts below as an example of how to use Inverted Technical Analysis to study a chart for a held stock position. We will pretend that you own this stock, and now that it is moving down, the concern is whether to hold or sell the stock. See candlestick chart example #1 below.
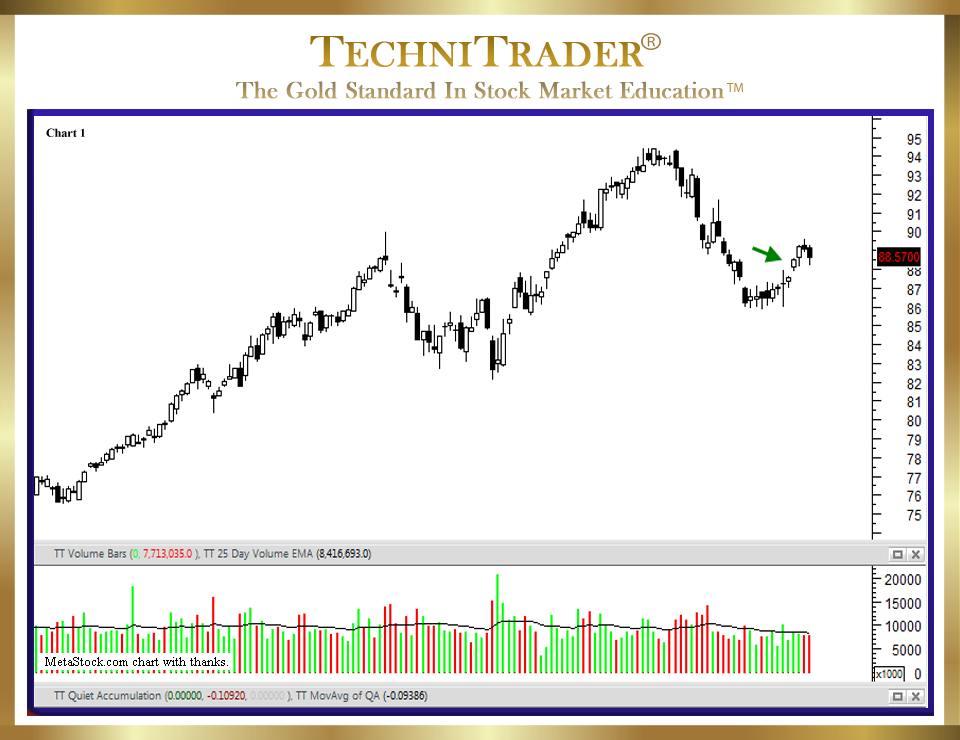
Let’s say that the entry or buy was on the small gap up white candlestick day indicated by the green arrow. It moved up the next day as well, and then it started to correct. This was a bit of a surprise as the expected action was more upside, especially since the index this stock is on went up over 100 points each day that this stock moved down.
Nervousness is settling in, and you are wondering whether to hold or sell the stock. You have a small profit for now. You are wondering why this stock is moving down when its index and the general market have been moving up strongly.
You are hoping that the stock is going to move up, but you aren’t sure. Instead of hoping, worrying, or giving up on the trade, use Inverted Technical Analysis and take a totally different perspective. Look at the chart and determine if this stock is a good Sell Short candidate.
Of course, in order to do this, you need to have an education in sell side action. The sell side aka downside action is not the same as the buy side aka upside action. Price moves differently on the sell side because there are fewer Stock Market Participants that Sell Short.
Stock selling is done for different reasons than when the Stock Market Participant Groups are buying. In addition, when a stock moves down, there are often Dark Pools lurking that most Retail Traders are unaware exist in certain price levels and ranges.
Candlestick chart example #2 below shows how to use Inverted Technical Analysis with support lines, which are set at the levels of their prior Dark Pool Quiet Accumulation.
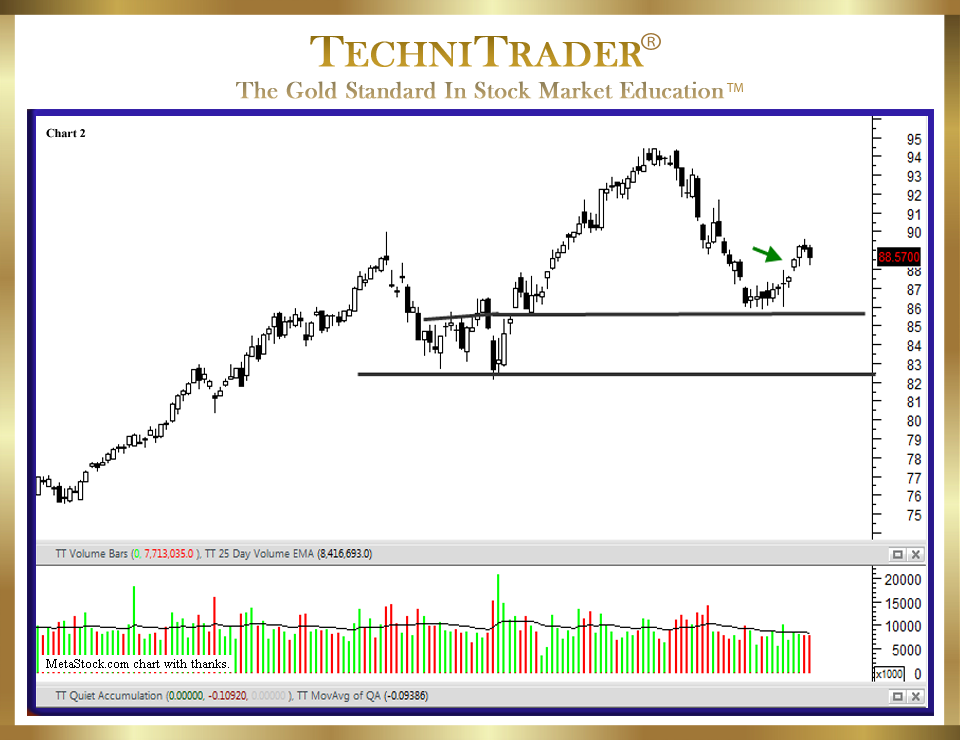
We can now quickly determine where Dark Pools are likely to enter again. We can also determine how far the stock can move down before it will find support for either a bounce or a rebound that will convert back to an upside run.
LEARN MORE at TechniTrader.Courses
Trade Wisely,
Martha Stokes CMT
TechniTrader technical analysis using MetaStock charts, courtesy of Innovative Market Analysis, LLC dba MetaStock
Chartered Market Technician
Instructor & Developer of TechniTrader Stock & Option Courses
Copyright ©2017–2024 Decisions Unlimited, Inc. dba TechniTrader. All rights reserved.
TechniTrader is also a registered trademark of Decisions Unlimited, Inc.