
How to Identify Candlestick Patterns of Bounces, Rebounds, & Reversals
Recognizing 3 Types of Upside Price Action in a Downtrend
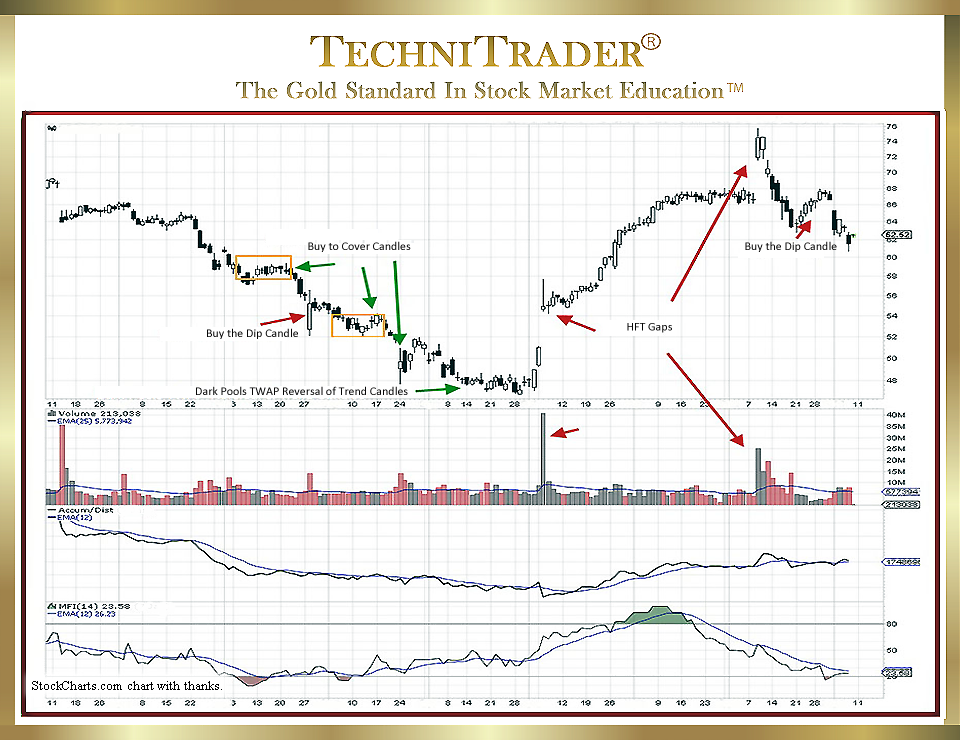
During a Downtrend, price does not just go down; instead, it often has brief periods where it moves up. Determining whether it is just a Bounce, Rebound, or a true Reversal requires Spatial Pattern Recognition Skills™ to read the stock chart properly.
The stock chart example below shows the different candlestick patterns of Bounces, Rebounds, and Reversals.
Everyone learns the basics of candlesticks, as this is currently the most popular stock chart style to use. However, just learning the Japanese continuation or reversal patterns is where a Technical Trader starts. If a trader wants to become a proficient Semi-Professional or Professional income-earning Trader, then they must learn more than just these basics.
How to Identify Candlestick Patterns of Bounces, Rebounds, and Reversals requires recognizing the three types of upside price action in a Downtrend. Each type is different for several reasons, which include the following:
1. Which Stock Market Participant Groups are in control of price at the time:
a. Professional Traders who Sell Short
b. Retail Investors or Retail Traders typically using guru recommendations
c. High Frequency Traders (HFTs) trading to move price
d. Dark Pools aka the giant Buy Side Institutions who are long-term investors buying on behalf of their Mutual Fund Holders
LEARN MORE at TechniTrader.Courses
Trade Wisely,
Martha Stokes CMT
TechniTrader technical analysis using a StockCharts chart, courtesy of StockCharts.com
Chartered Market Technician
Instructor & Developer of TechniTrader Stock & Option Courses
Copyright ©2017–2024 Decisions Unlimited, Inc. dba TechniTrader. All rights reserved.
TechniTrader is also a registered trademark of Decisions Unlimited, Inc.