
What Is the Best Earnings Season Trading Strategy?
An Analysis Comparing Chart Indicators and Price
The Best Earnings Season Trading Strategy will not be the commonly used momentum strategies, but a newer type of analysis focused more on what is exposing overperformance and underperformance in stocks. This can easily be seen in most stock charts with the right indicators and price analysis tools. A factor that charts reveal easily is when earnings and revenues diverge.
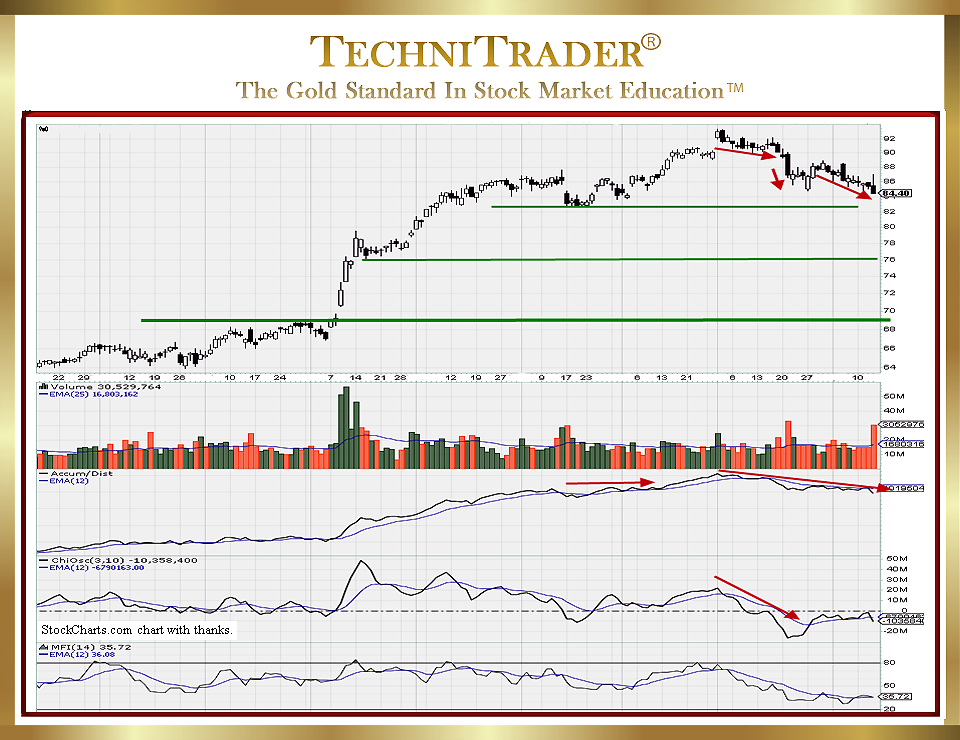
The chart example below shows Dark Pool Quiet Rotation™ began after the last Earnings Report. Some Smaller Funds bought the stock as it hit a new all-time high. Indications for Selling Short this stock appeared in the chart well ahead of the Earnings Report release date. The risk of High Frequency Trading orders triggering is increasing as it heads toward a weak support level.
Comparing the charts of those firms that have reported earnings, a common price pattern in relation to large-lot activity using Relational Technical Analysis™ is evident. You don’t even need to know the Earnings Report results. The facts are clearly stated in the stock chart with analysis of the price to large-lot activity.
In the chart example above prior to the release of the Earnings Report, this stock had been heading down in a slip slide pattern with intermittent Small-Lot Investors Buying the Dip into a Market Correction.
LEARN MORE at TechniTrader.Courses
Trade Wisely,
Martha Stokes CMT
TechniTrader technical analysis using a StockCharts chart, courtesy of StockCharts.com
Chartered Market Technician
Instructor & Developer of TechniTrader Stock & Option Courses
Copyright ©2017–2024 Decisions Unlimited, Inc. dba TechniTrader. All rights reserved.
TechniTrader is also a registered trademark of Decisions Unlimited, Inc.