
How to Use Balance of Power Indicator for Investing and Trading
List of 5 Uses That Reveal Dark Pools
One of the constants in a rapidly evolving Stock Market Structure is that indicator analysis is changing with it. Often, a popular indicator suddenly becomes unreliable or inconsistent, making it confusing for the Individual Investor or Retail Trader to try and figure out how to interpret it. Use the Balance of Power (BOP) indicator for investing and trading because it leads price and reveals where giant Buy Side Institutions are quietly accumulating stock. It is one of the other indicators that is evolving and becoming more useful, more indicative, and far more important to investing and trading.
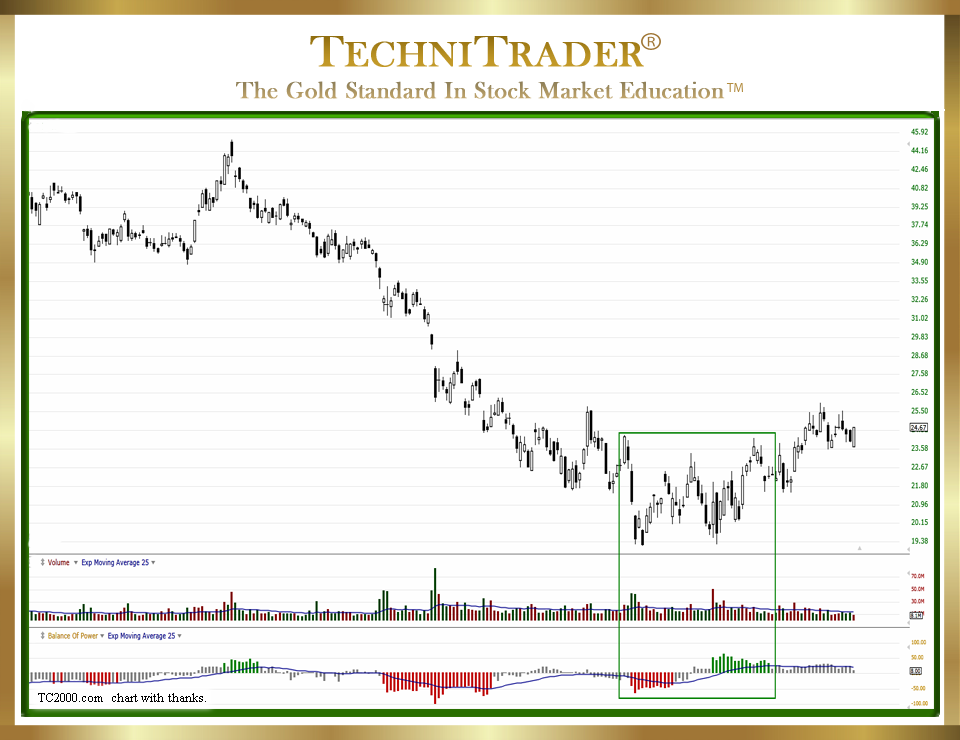
See the candlestick chart example below for the Shift of Sentiment™ revealed in the Balance of Power indicator bars and the Dark Pool Buy Zone™ Candlestick Pattern.
Indicators will evolve due to market structural changes because of how Stock Market Participant Groups obtain information and how they analyze it. This also depends on when the information is available and to whom. All of this together is reshaping how indicators function in relationship to Candlestick Pattern Formations.
This is often an area missed by tunnel-vision strategies as well as trading systems that do not or cannot adapt to the changing Market Conditions and Stock Market Structure. A lack of adaptation is creating weak trades and less profitability for Individual Investors and many Retail Traders.
One indicator that has evolved and become far more than it was ever intended by its writer and developer is now one of the most important indicators for Individual Investors and Retail Traders.
Yet few know about it, and even fewer understand how to interpret its patterns and what each pattern means in our current Stock Market Structure. Balance of Power is one of the most important indicators ever written. However, Individual Investors and Retail Traders often simply do not understand how to interpret it because they are unable to use it properly.
Here is a list of how to use this powerful stock indicator:
- Shift of Sentiment
Balance of Power has the ability to consistently expose Shifts of Sentiment at tops and bottoms. These are critical areas for proper analysis in order to enter or exit early and thus hold on to profits or gain more profits. In addition, they are key signal patterns that tell an Individual Investor or Retail Trader that a stock top or bottom has started. - Dark Pool Activity
The mistake most Individual Investors and Retail Traders make is to assume that really long Balance of Power bars are Dark Pool activity. Only the giant and larger Buy Side Institutions use Alternative Trading Systems (ATSs) which create Dark Pools. There are only about 30 giants and a couple hundred larger funds, and so their Balance of Power pattern is NOT long Balance of Power indicator bars. Balance of Power does reveal Dark Pool Quiet Accumulation when you know what to look for in the indicator, and its relationship to Price and stock Volume.
LEARN MORE at TechniTrader.Courses
Trade Wisely,
Martha Stokes CMT
TechniTrader technical analysis using a TC2000 chart, courtesy of Worden Bros.
Chartered Market Technician
Instructor & Developer of TechniTrader Stock & Option Courses
Copyright ©2015–2024 Decisions Unlimited, Inc. dba TechniTrader. All rights reserved.
TechniTrader is also a registered trademark of Decisions Unlimited, Inc.