
Why Do Extraordinarily Long Indecision Day Candlestick Patterns Occur?
List of Guidelines for Their Market Conditions
Candlesticks that form on days where neither the sellers nor the buyers take total control of price and move it strongly in one direction are called Indecision Day Candlestick Patterns. Indecision days are mostly very small-bodied candlesticks with small wicks and tails that are longer than the body.
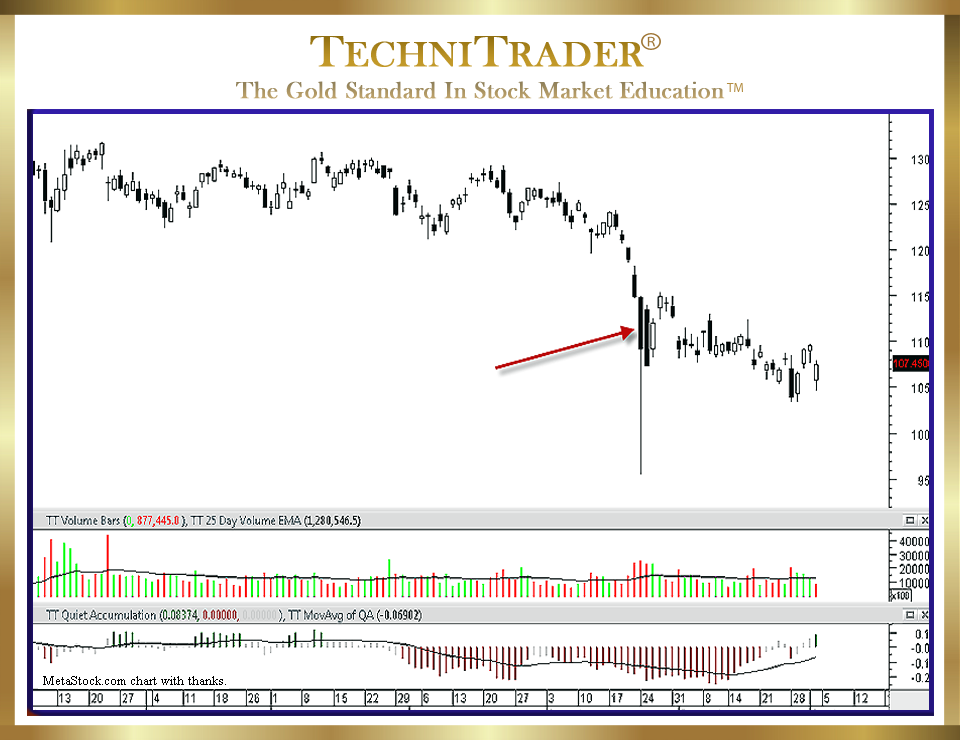
The stock chart below is marked with a red arrow to show an example of an extraordinarily large Indecision Day Candlestick.
Here is a list of guidelines for dealing with severe sell down Market Conditions’ action that creates numerous extraordinarily large Indecision Day Candlestick Patterns, which distort price so much that Price and Time Indicators are not giving a proper signal:
- The extraordinarily large indecision day is caused by a Market Event or Global Event and therefore doesn’t represent the trend on that day.
- If the stock has already been Trending Down, the rebound within the indecision day can be huge on that day. However, most of the time the following day will be a down day, continuing the original trend.
- If the stock is in an uptrend, the extraordinarily large indecision day candlestick will be followed most often by a gap up that sells down, creating a black candlestick. During the following days, the stock will slowly sort out the selling and return to the uptrend.
LEARN MORE at TechniTrader.Courses
Trade Wisely,
Martha Stokes CMT
TechniTrader technical analysis using a MetaStock chart, courtesy of Innovative Market Analysis, LLC dba MetaStock
Chartered Market Technician
Instructor & Developer of TechniTrader Stock & Option Courses
Copyright ©2015–2024 Decisions Unlimited, Inc. dba TechniTrader. All rights reserved.
TechniTrader is also a registered trademark of Decisions Unlimited, Inc.