
How to Sell Short Using a Swing Trading Style
Learn to Identify Trading Entry Candlestick Patterns
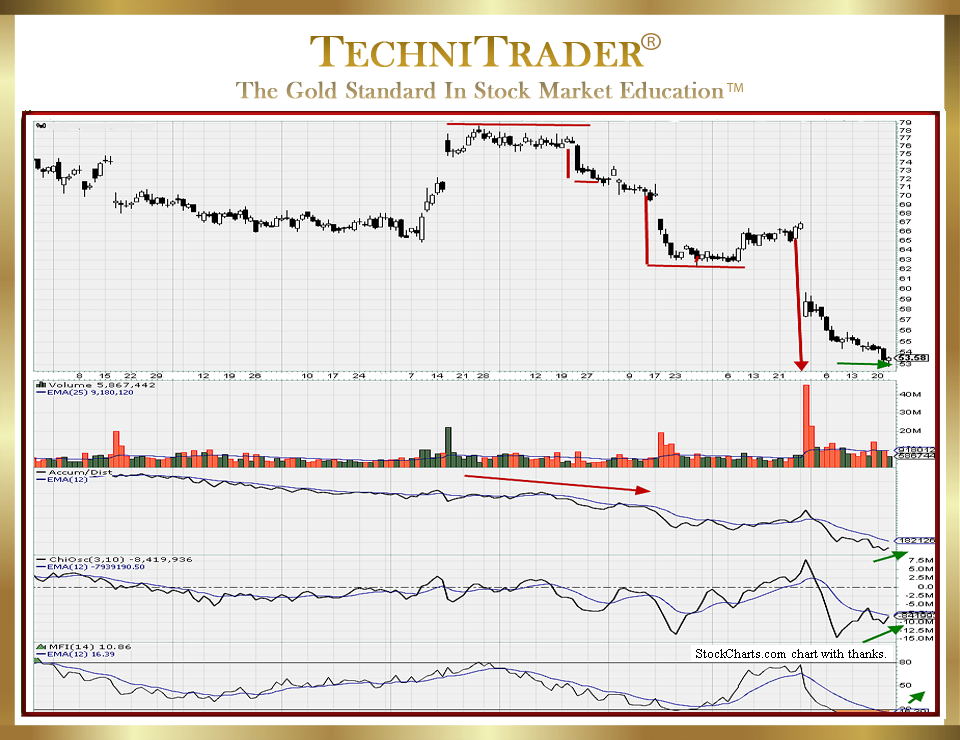
The stock chart example below shows a Flat Top Candlestick Pattern for Sell Short Swing Trading. This setup has strong run gain potential as the stock falls from its Topping Candlestick Pattern. The chart also shows examples of a High Frequency Trader (HFT) Exhaustion Gap, final capitulation by Smaller Funds, and Dark Pools’ bargain hunting, which commences at the earliest phase of a stock chart bottom.
To Sell Short Using a Swing Trading Style requires that you are able to identify these distinctly different candlestick patterns:
- Buy to Cover Candlestick Patterns. These price action patterns form during a downtrend with Swing Trading Style action. The candlesticks nestle into prior longer candlesticks; they are usually very small white candlesticks and not indecision day candlesticks. Strong Buy to Cover candlesticks are actually continuation patterns in many runs down. These candlesticks are created by the typical controlled exit of the Professional Traders who Sell Short during downtrending markets.
- Buy the Dip Candlestick Patterns. These are very different from the Buy to Cover Candlestick Patterns. The veteran Professional Trader aka Institutional Trader knows a Market Correction when it appears on their charts and is ready to Sell Short when the uptrend ends.
Retail Investors, Retail Traders, and Smaller Funds are the Stock Market Participant Groups responsible for the candlesticks that form a Buy the Dip pattern. - Bargain Hunter Candlestick Patterns. These are the Dark Pool footprints that occur ahead of the final low for the Market Correction of a stock or index. These are very precise and controlled entry candlestick patterns. They are often within a tighter range due to the use of Time Weighted Average Price (TWAP) orders as well as other controlled entry orders, which are routed through Dark Pool and Twilight Pool venues.
LEARN MORE at TechniTrader.Courses
Trade Wisely,
Martha Stokes CMT
TechniTrader technical analysis using a StockCharts chart, courtesy of StockCharts.com
Chartered Market Technician
Instructor & Developer of TechniTrader Stock & Option Courses
Copyright ©2017–2024 Decisions Unlimited, Inc. dba TechniTrader. All rights reserved.
TechniTrader is also a registered trademark of Decisions Unlimited, Inc.