
How to Identify Price Action Trading in Topping Stocks
New Candlestick Patterns That Reveal Potential Tops
One of the more challenging aspects of being a Technical Trader or Retail Trader in the automated markets today is that the candlestick patterns of Technical Analysis are changing. In particular, How to Identify Price Action Trading in Topping Stocks is often the most problematic, as traders are not aware of the changing dynamics of tops. On the short-term trend for Price Action Trading, there are new candlestick patterns that are often missed by traders who have yet to learn Flat Tops, Sheer Cliff Tops, and many more.
The candlestick chart example below shows an Inverse Asymmetrical Triangle Candlestick Pattern on the short-term trend.
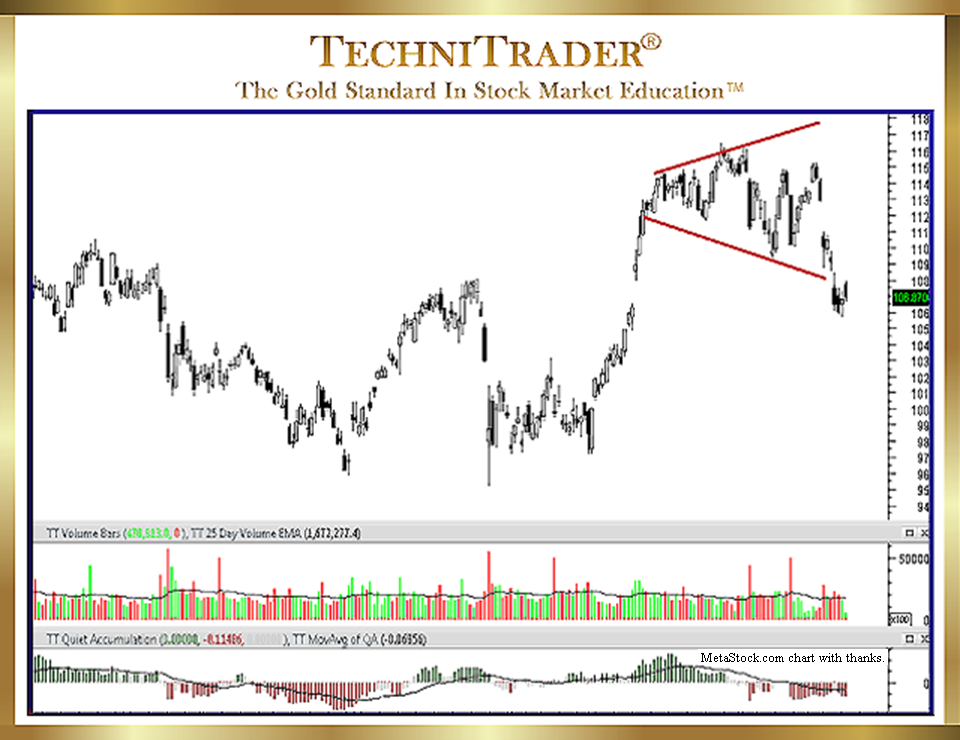
This is one of the most dangerous tops for traders who use Buy the Dip or Limit Order entries. Professional Traders abandoned Limit Orders quite a while ago, and they are using alternative orders to control their entries which avoid the huge risk of entering on a low and discovering that the entry is not a dip but a downtrend.
The risk factor of the Asymmetrical Triangle is that most traders are not thinking of this pattern as a reversal pattern. Many are not even aware that a triangle can expand rather than contract.
LEARN MORE at TechniTrader.Courses
Trade Wisely,
Martha Stokes CMT
TechniTrader technical analysis using a MetaStock chart, courtesy of Innovative Market Analysis, LLC dba MetaStock
Chartered Market Technician
Instructor & Developer of TechniTrader Stock & Option Courses
Copyright ©2017–2024 Decisions Unlimited, Inc. dba TechniTrader. All rights reserved.
TechniTrader is also a registered trademark of Decisions Unlimited, Inc.