
Changes to Market Structure Alter Balance of Power Interpretation
Worden TC2000 Balance of Power the Most Powerful Indicator Ever Written
TC2000 Users have a huge advantage over other Retail Traders, as they have the power of Worden Indicators at their disposal. However, recent changes to the Market Structure have altered how traders should interpret these indicators.
This discussion is about the Worden Indicator Balance of Power (BOP). Many TC2000 Users give up on this indicator because they cannot figure it out. This is because of the changes to how large lots buy and sell stocks, the various Stock Market Participant Groups who use large lots, and the Stock Order Types available to them.
One of the most common mistakes when using Balance of Power is to assume that long red bars represent distribution. This is a highly oversimplified analysis of one of the most powerful indicators ever written.
In order to use Balance of Power properly, traders must also analyze the following:
- WHERE in the Trend the Balance of Power is showing color or is neutral gray.
- How long the bars are and the duration of that length over time.
- The relationship between Price Patterns and Balance of Power.
- Liquidity and shares traded.
- The current Market Condition.
Here is an example of how to properly use the Worden Indicator Balance of Power. In the chart below, Balance of Power looks totally off-track, but that is simply because you may not know how to read this indicator. Let me take you step-by-step by first noticing the Trend. This stock has been in its own bearish downtrend for a year now, and a Weekly Chart View shows the classic top.
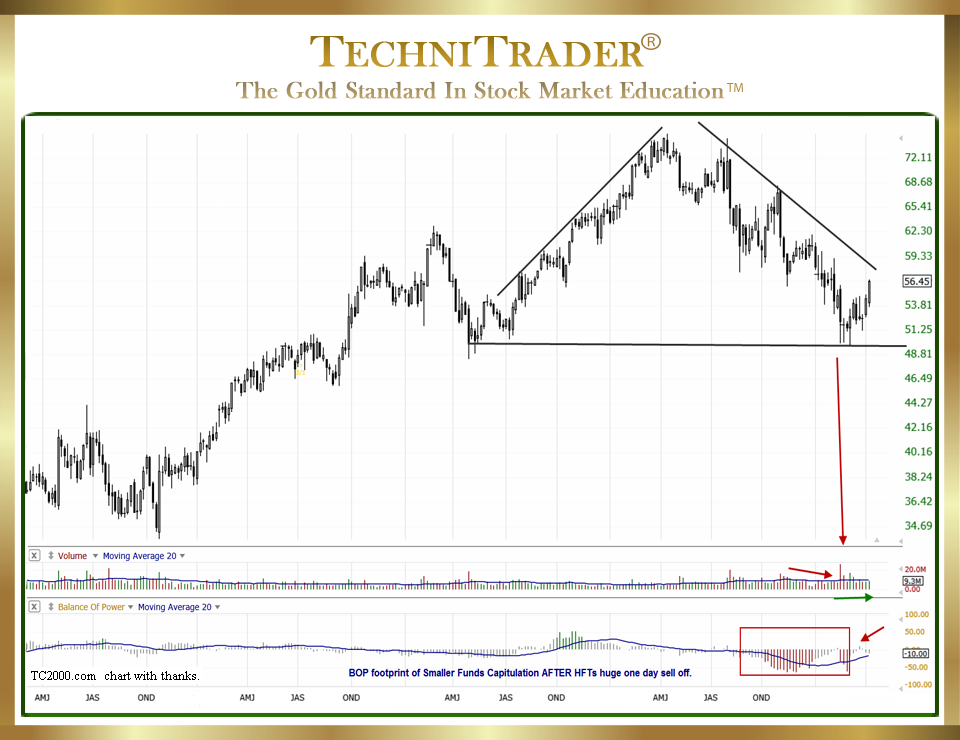
Also, see that it is at a prior low and that Balance of Power had a lot of red bars that recently turned gray over the past couple of weeks. This is NOT distribution. This is the final capitulation selling by Smaller Funds, who trade very similarly to the retail crowd because they have a lack of technical education and their Volume Weighted Average Price (VWAP) orders trigger AFTER a High Frequency Trader (HFT) stock Volume spike. I have noted the stock Volume spike on the chart for you with a red arrow. HFT downside action with high stock Volume triggers automated Volume Weighted Average Price orders, which are overly popular with Small Funds Managers. They are accidentally SELLING against the giant-lot institutions who are buying.
Note also on this Weekly Chart View that stock Volume is LOWER during the capitulation period and rising as giant-lot institutions start buying in Dark Pools.
LEARN MORE at TechniTrader.Courses
Trade Wisely,
Martha Stokes CMT
TechniTrader technical analysis using TC2000 charts, courtesy of Worden Bros.
Chartered Market Technician
Instructor & Developer of TechniTrader Stock & Option Courses
Copyright ©2016–2024 Decisions Unlimited, Inc. dba TechniTrader. All rights reserved.
TechniTrader is also a registered trademark of Decisions Unlimited, Inc.