
How to Use a Complete Data Set for Stock Analysis
Include a Volume Indicator for Stock Picks
In the early days of Technical Analysis, all of the data from the Stock Market was not readily available in a format that could be hand-drawn on a chart. The earliest chartists had to create their charts using either Point and Figure, Line, or Bar Charts. Candlesticks were not introduced to the western markets until the 1990s.
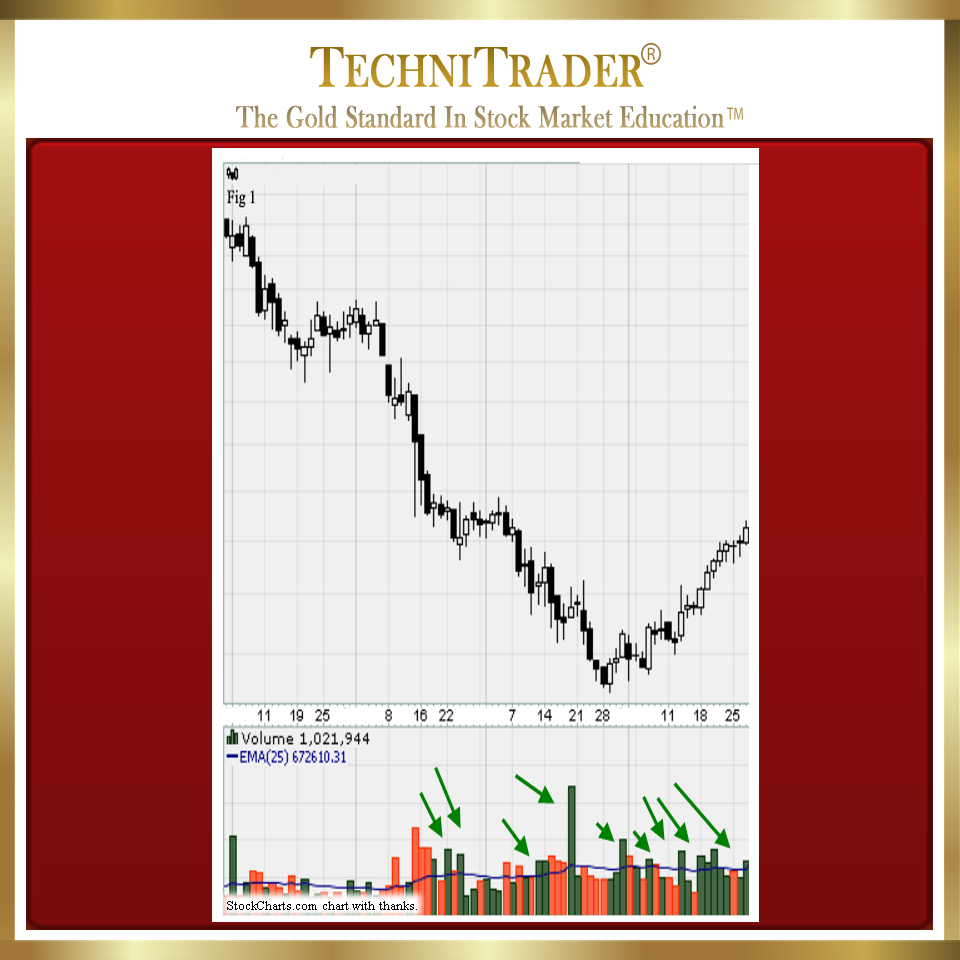
All charts in this article are of the same stock on different days in progression. Stock chart example #1 below has Quantity aka stock Volume to the upside that is above average during the final low and bottoming phase of this downtrend.
Data that was used on the earliest charts was primarily Price and Time. Stock Volume was seldom included, and it was fine to focus solely on Price because there were only a few exchanges and it was only rarely that off-exchange orders were filled. Nowadays, there are some 70+ Alternative Trading Systems (ATSs) and Exchange venues.
Since the bulk of orders now filled off-exchange are in Dark Pool venues, stock Volume has become a critical indicator in order to fully understand the dynamics of Price.
Adding stock Volume and stock Volume Leading Indicators provide the missing data needed in order to use a Complete Data Set for Stock Analysis, which is crucial in the automated Stock Market today.
High Frequency Trading is here to stay, and it is now an integral part of the “market making” computing community.
Market Makers or Maker-Takers receive a rebate from the exchanges for providing liquidity. High Frequency Traders (HFTs) have become a major contributor to maintaining the liquidity of exchange activity against the Dark Pool venues, which have controlled the bulk of orders for several years.
Dark Pools are often delayed orders during the day, OR the large-lot orders will fill before the market opens. Using a Complete Data Set for Stock Analysis must include using all data gathered from every venue after the market closes since the Consolidated Data differs considerably from End of Day (EOD) exchange Close Data, which is the closing data of the day.
Stock Volume bars provide considerable information beyond the “green is an up day, and red is a down day” in the basic courses for beginners. The length of the Volume bar matters. Using a Moving Average or other subordinate indicator can help determine the average of stock Volume, which provides an easy visual reference.
NEVER truncate your stock Volume Indicator. This is a mistake because the bars represent the total number of shares traded that day, and they will provide many “indications” required to understand who controls Price on that day.
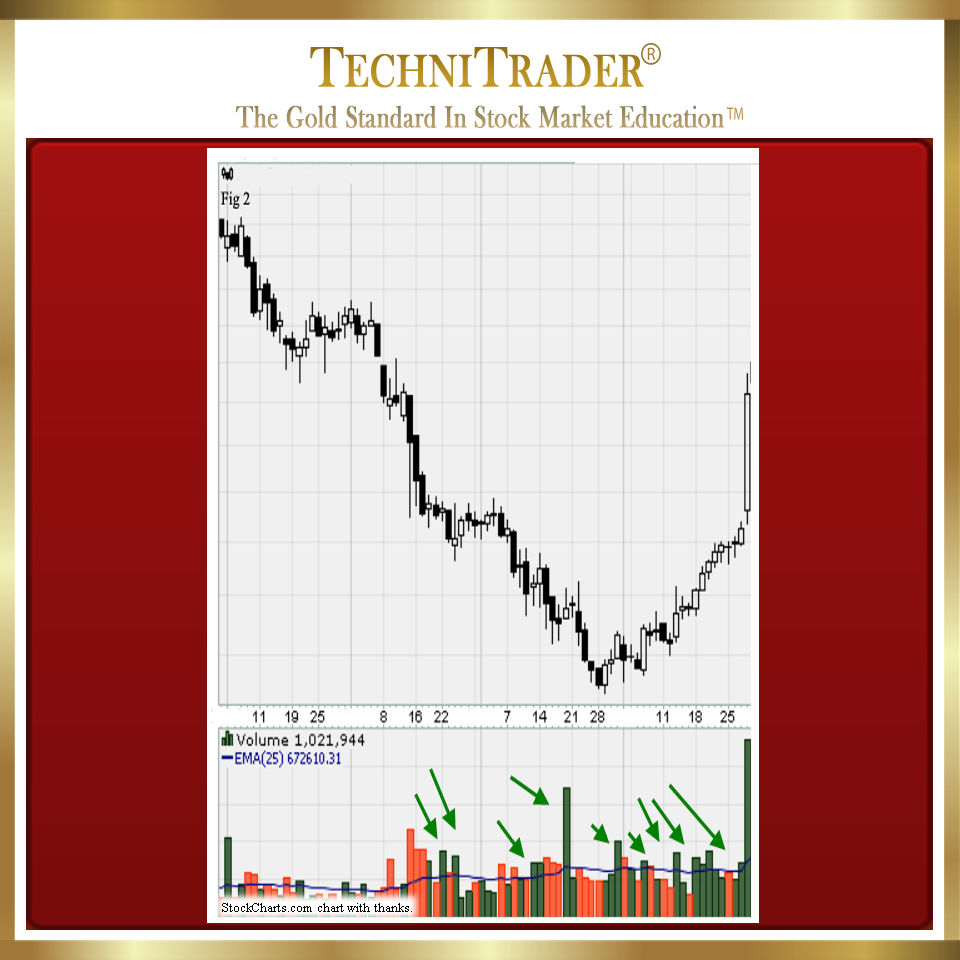
The next day after stock chart example #1, the stock moved with a huge point gain, a nice entry was set up the day before, and since the stock ran rather than gapped, this was good and easy Swing Trading. The stock Volume bars clearly indicated that the bottom had accumulation intermittently, and the compression of Price also indicates a potential for a High Frequency Trading run. See stock chart example #2 below.
LEARN MORE at TechniTrader.Courses
Trade Wisely,
Martha Stokes CMT
TechniTrader technical analysis using StockCharts charts, courtesy of StockCharts.com
Chartered Market Technician
Instructor & Developer of TechniTrader Stock & Option Courses
Copyright ©2017–2024 Decisions Unlimited, Inc. dba TechniTrader. All rights reserved.
TechniTrader is also a registered trademark of Decisions Unlimited, Inc.