How Do Dark Pools & High Frequency Traders Affect Stocks & Options?
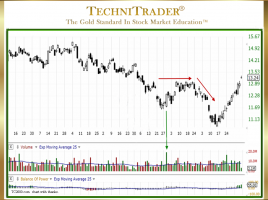
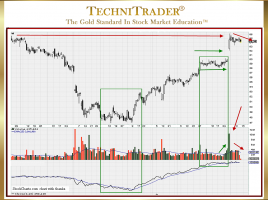
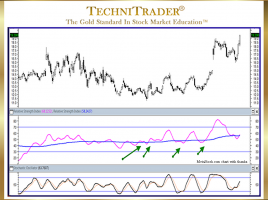
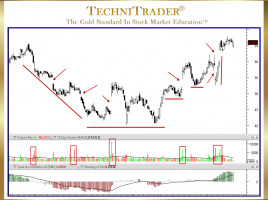
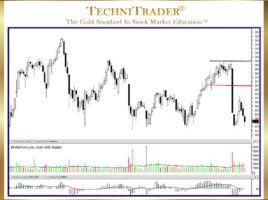
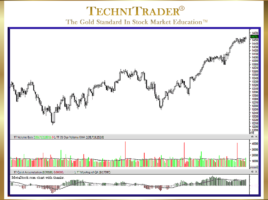
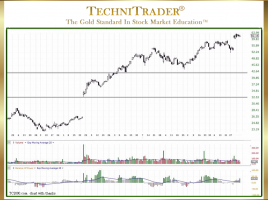
Two Dominant Stock Market Participant Groups Explained There are two dominant Stock Market Participant Groups in the Stock and Options Markets. The giant Buy Side Institutions use Alternative Trading Systems (ATSs), which create Dark Pools to hide their buying and selling. Their counterparts are the High Frequency Traders (HFTs), which …