Currently browsing tag

gap

Why Analyze Sideways Bottoming Stock Trends?

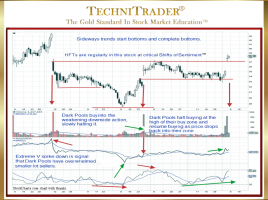
To Identify Dark Pool Buy Zones™ The Shift of Sentiment™ pattern in the stock chart example below clearly and easily shows that Buy Side Institutions using Dark Pools entered this stock and would quickly take control of price. Sideways bottoming stock trend analysis of the chart shows that a sudden …

Why Did Options Trading Opportunities Increase?

Traders Are Using Stock Chart Analysis Options Trading has suddenly become far more popular with Professional Traders and Smaller Funds, who are now learning to trade Options. This means that Retail Traders will find more trading volume and opportunities than what have been around previously. It is the Renaissance of …