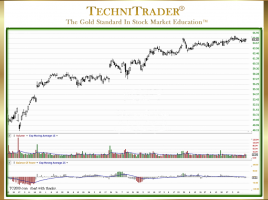
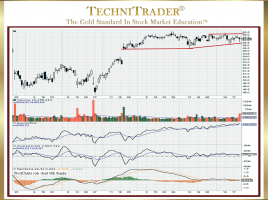
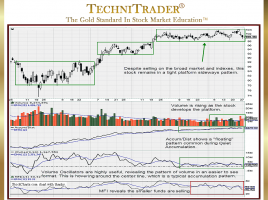
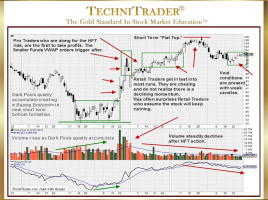
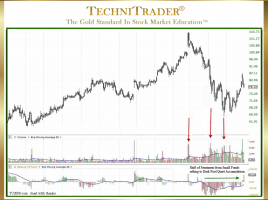
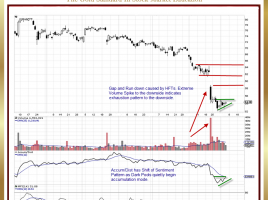
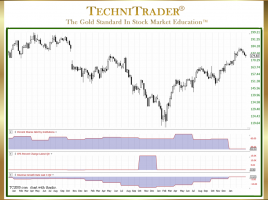
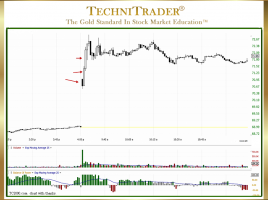
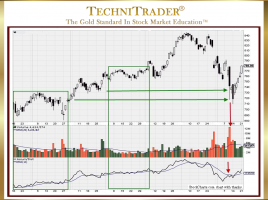
Currently browsing tag

Relational Technical Analysis

What Is Advanced Technical Analysis of Candlestick Charts?

List of Tips for Choosing High-Quality Stock Picks Advanced Technical Analysis of Candlestick Charts for Trading Stocks gives you more opportunities to trade high-quality stock picks that earn more profits per trade. The goal with every trade you make should be higher profits per trade. Taking pennies for profit on …

Why Recognize MACD Contrarian Indicator Patterns?

Sideways Candlestick Pattern Breakout Direction Oftentimes, traders may be confused with conflicting indicator patterns. Contrarian patterns between indicators and between Price and stock Volume-based Indicators are very common these days. In the stock chart example below, the stock gapped up on earnings news and shifted to a sideways candlestick pattern …

How to Interpret Extreme Candlestick Patterns

Identify Dark Pool Buy Zones™ in Stock Bottom Formations Every Technical Trader and Retail Trader knows that Bottom Formations are often completed with a Momentum or Velocity Run, but few are able to capture those big gains because they are unable to recognize the candlestick patterns that precede the run. …

3 pages