Currently browsing tag

sideways candlestick patterns

How Does Stock Fundamental Support Form?

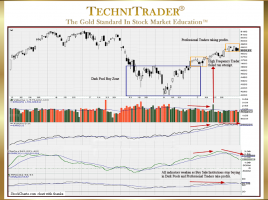
By Dark Pool Candlestick Pattern Platforms Fundamental Investors and Traders are the Buy Side Institutions, who use Dark Pools to buy and sell large to giant lots and block orders. Often trading short-term are the Sell Side Institutions and Smaller Funds. Small-Lot Retail Investors are negligible and tend not to …

How to Cope with Volatile Trading Conditions

Find Stocks That Have Compressing Sideways Candlestick Patterns Trading so-called “Volatile Markets” can seem like a daunting task. Many Retail Traders struggle during these phases of trading action and do not recognize how to cope with “Volatile” Trading Conditions. The problem is not that stock price action is “Volatile”, but …

Why Recognize MACD Contrarian Indicator Patterns?

Sideways Candlestick Pattern Breakout Direction Oftentimes, traders may be confused with conflicting indicator patterns. Contrarian patterns between indicators and between Price and stock Volume-based Indicators are very common these days. In the stock chart example below, the stock gapped up on earnings news and shifted to a sideways candlestick pattern …

What Are the 5 Key Aspects of Technical Analysis?

Candlestick Patterns Reveal Who, What, Where, When, and Why Technical Analysis is the study and interpretation of price, time, and stock volume for stocks and indexes. Due to the massive changes to the Stock Market Structure since the Banking Debacle and Subprime Mortgage disaster, Technical Analysis has been evolving and …