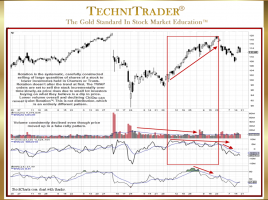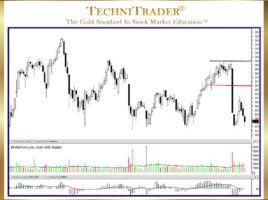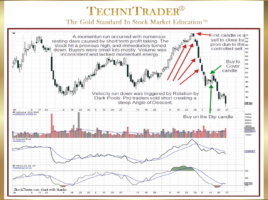
What Is the Anatomy of a Sell Down Momentum Run?
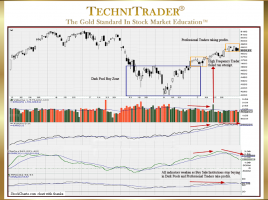
List of Differences Between Upside & Downside Candlesticks During an Intermediate-Term Correction caused by several major industries in an industry cycle Bear Market, Sell Down Momentum Runs can be a lucrative trading method for Swing, Day, and Momentum Traders who know how to Sell Short or trade “put” Options. See …