Currently browsing tag

volume spikes

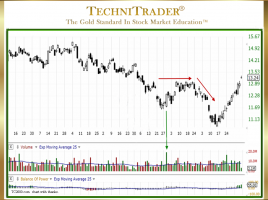
How to Identify High Frequency Trader Activity

List Provided to Recognize Their Candlestick Patterns High Frequency Trader (HFT) activity occurs often these days, and the HFT candlestick patterns are substantial but unsustainable. Retail Traders who want to learn how to Sell Short during topping markets and downtrends need to be able to identify the “footprints” of the …

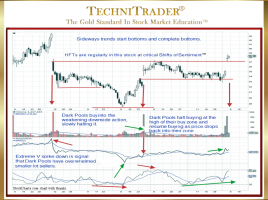
Why Analyze Sideways Bottoming Stock Trends?

To Identify Dark Pool Buy Zones™ The Shift of Sentiment™ pattern in the stock chart example below clearly and easily shows that Buy Side Institutions using Dark Pools entered this stock and would quickly take control of price. Sideways bottoming stock trend analysis of the chart shows that a sudden …