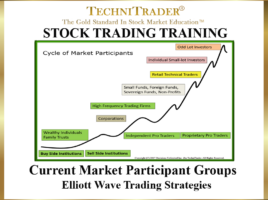
Elliott Wave Trading Strategies

How to Understand the Wave Cycles for Entries and Exits The foundation of the Elliott Wave Theory is from the Charles Dow Theory that the market moves in waves and cycles. These cycles have been altered in recent years due to the massive internal structural changes of the Stock Market …

Indicators for Earnings Report Trading Strategies

Trade Earnings by Tracking Professional Traders & High Frequency Traders Earnings Season provides plenty of strong momentum runs for Swing and Day Traders. However, many traders struggle with determining how the stock will move on the day of the report release. To succeed at finding Professional Traders’ footprints before an …

Where Is Support for Swing Trading Style Runs?

Stronger and Weaker Support Explained Support and Resistance are often areas of Technical Analysis that are not fully understood. Swing Trading includes Momentum Runs, Velocity Runs, Volatile Runs, and Intraday Swing-Style Runs, each of which have their own Support and Resistance. The chart example below had a Standard Swing Run …

How to Identify Topping Action with Bollinger Bands®

Use Bollinger Bands with Quantity Indicators Bollinger Bands are an outstanding indicator for analyzing sideways candlestick patterns. The bands’ ability to expand and contract revealing the amplitude of price is a critical factor for accurately identifying breakout action before price moves up or down. Use Bollinger Bands topping action to …

Why Is There Burgeoning Success of Position Trading?

It Is a Reliable Low-Risk Entry Trading Style Position Trading is a newer Trading Style that most people haven’t heard about, unless they are a TechniTrader Student. I developed this Trading Style for choppy Sideways Market Conditions. More and more of the Large and Giant Funds Managers have moved their …

18 pages