
Indicators for Earnings Report Trading Strategies
Trade Earnings by Tracking Professional Traders & High Frequency Traders
Earnings Season provides plenty of strong momentum runs for Swing and Day Traders. However, many traders struggle with determining how the stock will move on the day of the report release.
To succeed at finding Professional Traders’ footprints before an earnings release is the best way to determine whether the stock will have a strong upside momentum run or downside run. This is done by adding a couple of new indicators to your analysis.
The most common mistake that Retail and Technical Traders make is the overuse of Price Indicators. In today’s market, stock Volume Indicators are far more useful in revealing where Dark Pools have accumulated, rotated, or distributed. They also reveal where Professional Traders are most active and on which side of the trade. This is important because most large lots are not visible on the intraday exchange price action.
Instead, most larger lots are transacted off the exchanges on Alternative Trading System (ATS) Venues that hide the large-lot activity. When larger lots are buying or selling, this weights the balance to that side of the trade. If sufficient larger lots move in, price will react at some point and move in that direction. Identifying which side of the order the larger lot is on is how you tell whether the stock will move up or down.
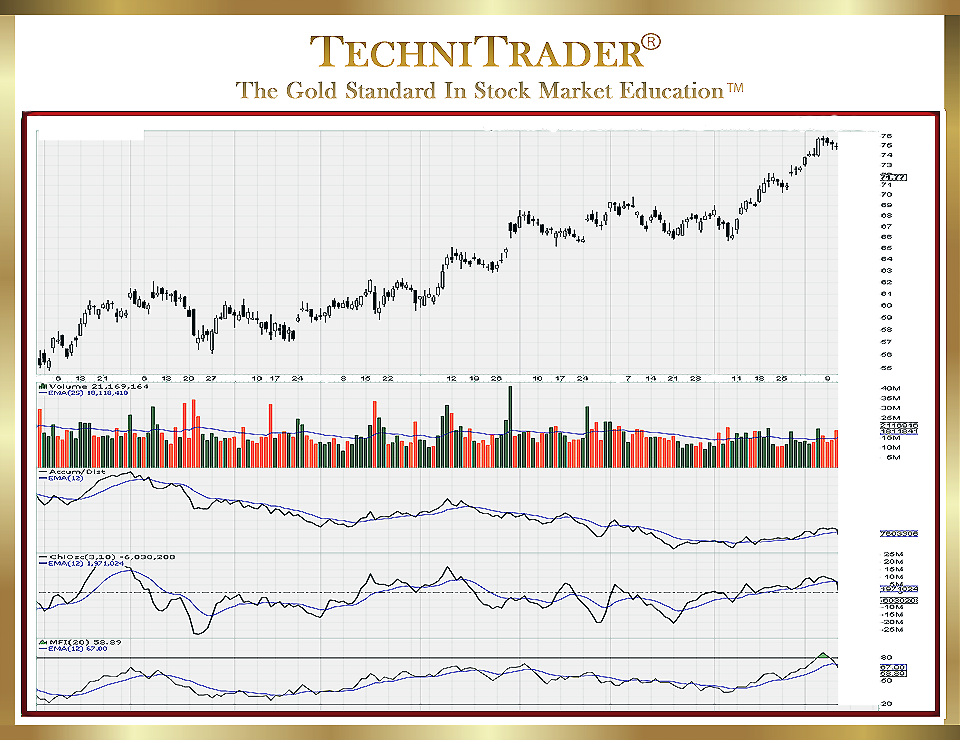
This is not easily done with Price Indicators because nowadays the Professional Traders, Dark Pools, and accredited Technical Traders all use professional venues and specialized routing that allows them to execute precisely on a penny or a half penny. This means price will hover in a tight price pattern the day before the Earnings Report is released, as seen on the chart example below.
Information about this stock and its Earnings Report comes late to the retail crowd. By the time it reaches Retail Traders, Professionals and especially the Dark Pools already know the report’s content. Therefore, they have already traded on that report before its official release.
The chart example below shows a tight price formation ahead of the release. This stock has been running up with swing-style runs out of a platform sideways candlestick pattern. This is often perceived by Retail Traders as a Buy the Dip pattern, and sometimes it can be such. However, without the special indicators below the price chart, a Retail Trader would not see that this is not an ideal Buy the Dip or Earnings Report strategy.
LEARN MORE at TechniTrader.Courses
Trade Wisely,
Martha Stokes CMT
TechniTrader technical analysis using StockCharts charts, courtesy of StockCharts.com
Chartered Market Technician
Instructor & Developer of TechniTrader Stock & Option Courses
Copyright ©2017–2024 Decisions Unlimited, Inc. dba TechniTrader. All rights reserved.
TechniTrader is also a registered trademark of Decisions Unlimited, Inc.