
How to Identify High Frequency Trader Activity
List Provided to Recognize Their Candlestick Patterns
High Frequency Trader (HFT) activity occurs often these days, and the HFT candlestick patterns are substantial but unsustainable. Retail Traders who want to learn how to Sell Short during topping markets and downtrends need to be able to identify the “footprints” of the Professional Traders and Technical Traders versus the High Frequency Trading patterns. These Stock Market Participant Groups leave a different candlestick pattern footprint on the stock chart, which enables the Retail Traders to distinguish between them and thus be able to determine what price will do next.
Technical Traders are Semi-Professional Retail Traders who have a proper education and trading process and are able to trade larger lots successfully. Professional Traders and Technical Traders earn high incomes trading stocks and are technically oriented in their trading. Therefore, their runs are based on the principles of modern Technical Analysis using Large-Lot Indicators vs. Small-Lot Indicators as well as other Leading Indicators. In addition, they use Western Candlesticks™ for precise entries instead of candlestick reversal or continuation patterns or indicator crossover signals, which are less reliable.
Below is stock chart example #1 with the footprints of the Professional Traders and Technical Traders as well as the High Frequency Traders outlined on the chart.
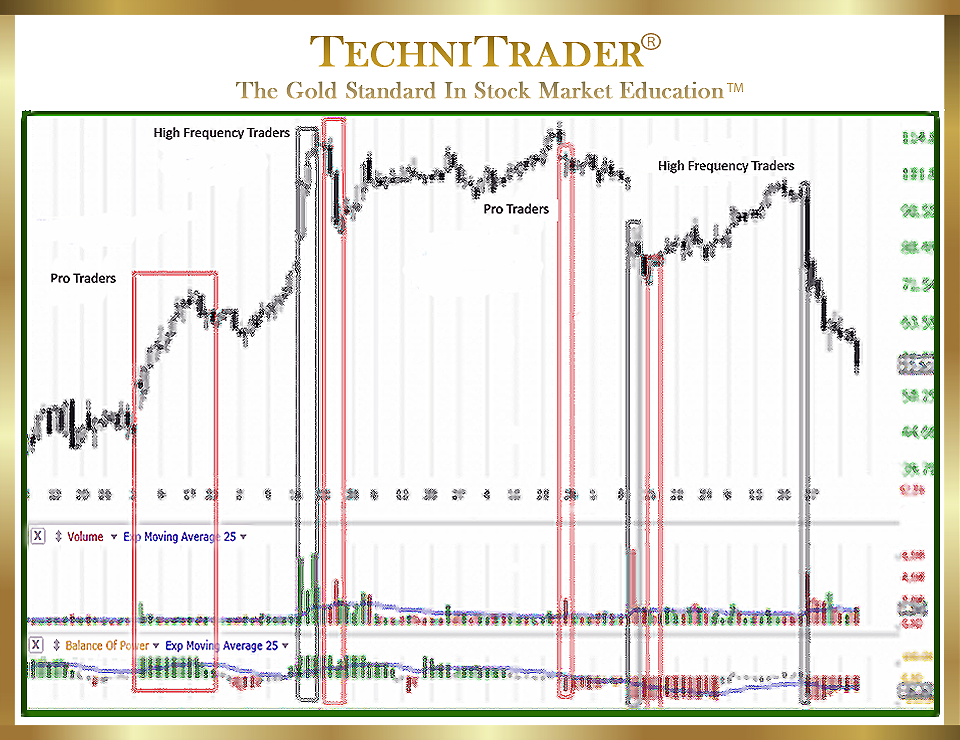
Professional Traders and Technical Traders follow the giant Buy Side Institutions using Dark Pools, getting in as soon as they recognize the Dark Pool footprint. This gives them a huge advantage because then they buy in ahead of the High Frequency Traders who chase the Dark Pools.
- Gaps Down
Big and huge gaps down are the results of the HFT candlestick patterns, and this chart example shows that Professional Traders and Technical Traders are Selling Short ahead of High Frequency Traders. The High Frequency Traders, as well as Professional Traders and Technical Traders, Buy to Cover on that gap down day and shortly thereafter.
Smaller Funds who tend to use Volume Weighted Average Price (VWAP) orders enter late into the stock, thereby chasing High Frequency Traders or Professional Traders. Entering the stock late is also true of Retail Traders using “trading systems”, outdated “trading strategies”, or “crossover indicator entries”. Entering late means that Retail Traders and Smaller Funds are often buying or selling against the large-lot Professional Traders and Technical Traders, and this is a primary cause of whipsaw trades for them. - Huge One-Day Runs
The HFT candlestick patterns include huge one-day runs down, as seen in stock chart example #1. These huge one-day runs are unsustainable.
LEARN MORE at TechniTrader.Courses
Trade Wisely,
Martha Stokes CMT
TechniTrader technical analysis using TC2000 charts, courtesy of Worden Bros.
Chartered Market Technician
Instructor & Developer of TechniTrader Stock & Option Courses
Copyright ©2017–2024 Decisions Unlimited, Inc. dba TechniTrader. All rights reserved.
TechniTrader is also a registered trademark of Decisions Unlimited, Inc.