
How to Use Bollinger Bands® in MetaStock Charts
Add Stock Volume Indicators for Direction Stock Will Move
The Bollinger Bands indicator has been gaining in popularity. This is no surprise, given the changes in the Market Structure and how price behaves with more of the Exchanges, Dark Pool Alternative Trading Systems (ATSs), Electronic Communication Networks (ECNs), and other orders now automated.
Below is a chart example of a stock that had been in a Trading Range pattern over a few months and then had a High Frequency Trader (HFT) velocity run. The current compression shows nearly perfect horizontal Bollinger Bands on both the upper and lower bands, indicating that price is compressing inward equally from highs and lows. This is a powerful price pattern that is often missed by novice Retail Traders.
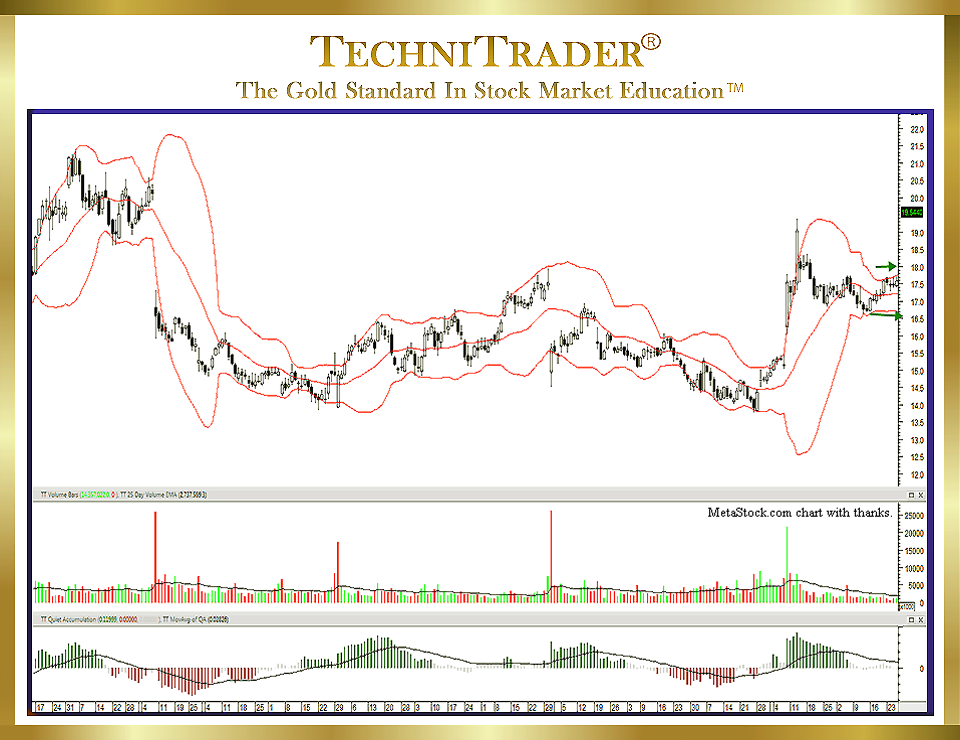
The equal compression means that there is equilibrium between buyers and sellers at that moment, which tends to favor the upside after an HFT-driven velocity run. Dark Pool Quiet Accumulation is underway with giant Buy Side Institutions using Alternative Trading Systems, their buying going on unnoticed for the moment as shown in the TechniTrader Quiet Accumulation (TTQA) indicator in the bottom chart window. Giant Buy Side Institutions using Dark Pools control price to create these candlestick patterns.
Since this first velocity run was triggered by High Frequency Traders, the next move up was likely to also be an HFT gain day. Over the next few days, the stock moves up a little higher and compresses again, and then High Frequency Traders move the stock up a couple of points in one day, as shown in the chart example below.
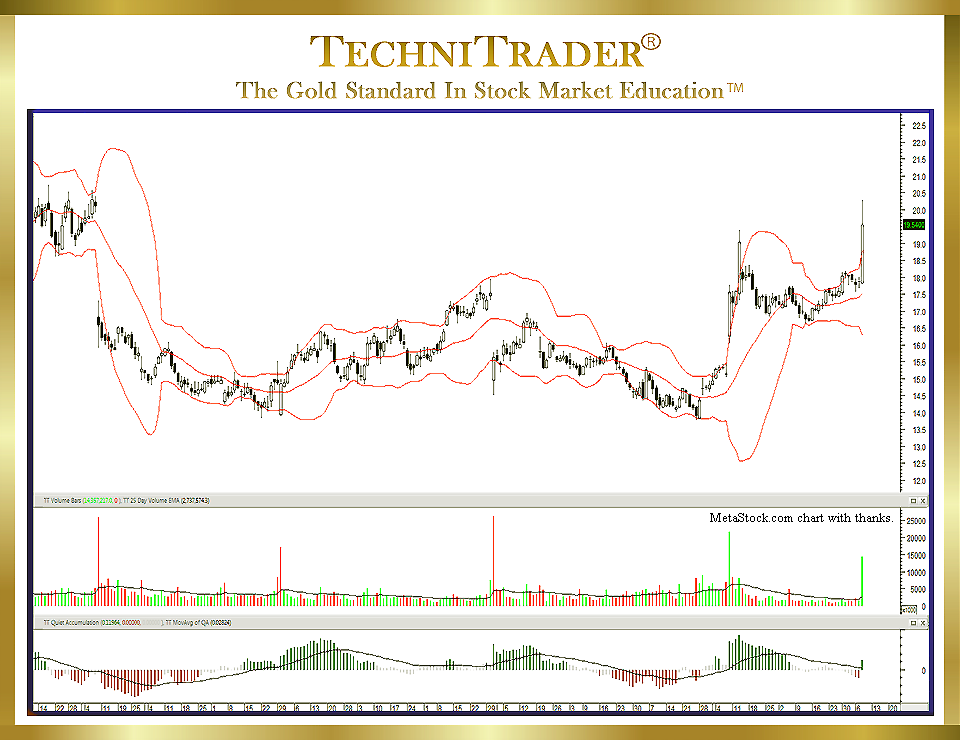
The entire sideways action after the first High Frequency Trader velocity run was a period of Dark Pool Quiet Accumulation with Dark Pools buying and the general market exchanges unaware of their activity. Once the word gets out, High Frequency Traders’ automated orders drive price upward. There were two entries before the stock moved on HFT price action, and both of them offered a low-risk entry prior to the big run day.
LEARN MORE at TechniTrader.Courses
Trade Wisely,
Martha Stokes CMT
TechniTrader technical analysis using MetaStock charts, courtesy of Innovative Market Analysis, LLC dba MetaStock
Chartered Market Technician
Instructor & Developer of TechniTrader Stock & Option Courses
Copyright ©2017–2024 Decisions Unlimited, Inc. dba TechniTrader. All rights reserved.
TechniTrader is also a registered trademark of Decisions Unlimited, Inc.