
Why Use Compression Candlestick Pattern Indicator Analysis?
Add Quantity Indicators to Allow for Early Entry into Stocks
All indicators have limitations and Market Conditions where the indicator fails, does not provide a true positive or negative pattern, or is simply unable to keep up with the speed of momentum price or stock volume activity. Bollinger Bands® are no exception. Bollinger Bands and the various other indicators written by John Bollinger CFA, CMT are excellent indicators; however, all indicators have times when they lag behind price.
Both chart examples in this article are the same stock. See chart example #1 below.
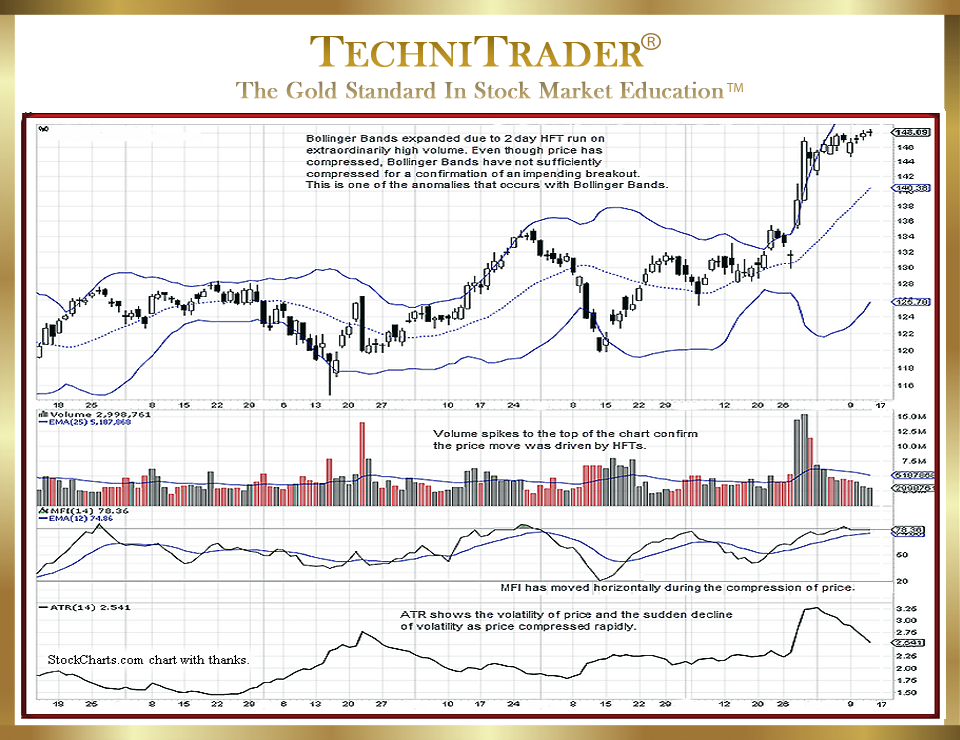
Adding Quantity Indicators to the analysis allowed for an early entry into this stock ahead of the High Frequency Trader (HFT) action. Chart example #2 has the stock Volume, Money Flow Index (MFI), and Accum/Dist indicators.
LEARN MORE at TechniTrader.Courses
Trade Wisely,
Martha Stokes CMT
TechniTrader technical analysis using StockCharts charts, courtesy of StockCharts.com
Chartered Market Technician
Instructor & Developer of TechniTrader Stock & Option Courses
Copyright ©2017–2024 Decisions Unlimited, Inc. dba TechniTrader. All rights reserved.
TechniTrader is also a registered trademark of Decisions Unlimited, Inc.