
How to Improve Bollinger Bands®
Add Quantity Indicators to Analysis for Stock & Options Trading
One of the most exasperating things that happen to Retail Traders and Technical Traders is to find a chart with a perfect setup but the stock has already gapped or ran up with a huge one-day gain, as High Frequency Trading algorithms triggered the gapping or running up of the stock in the first few minutes of the trading day.
Many traders want to learn how to capture these gains and be in the stock before a huge gap or big run day, and improving the use of Bollinger Bands is the best method. Bollinger Bands are the best Channel Indicator for Technical Trading and for finding breakout compression candlestick patterns prior to gaps or runs.
See the chart example below.
The ability of the bands to expand and contract makes them the ideal Channel Indicator to use. However, as with ALL Channel, Price, and Time Indicators, they require additional indicators as directional signals.
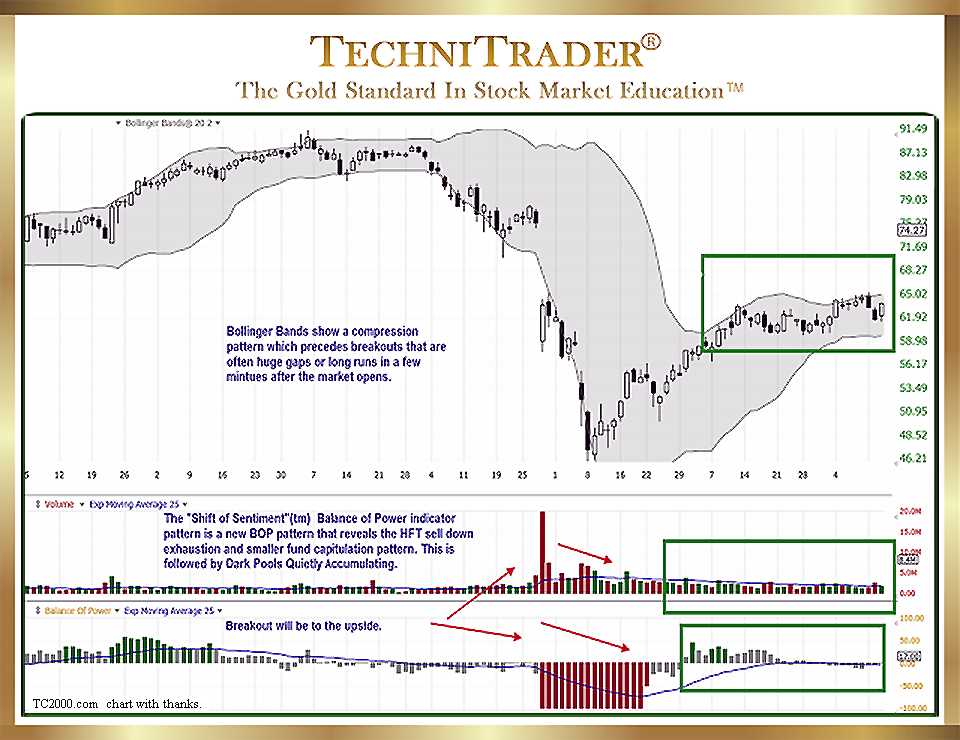
Bollinger Bands tell you that a stock is poised for a strong Momentum Run or Gap, but they do not tell you whether the Breakout will be to the Upside or the Downside.
During Trading Range Market Conditions, it is impossible to “guess” the Breakout direction solely using Price and Time Indicators.
Employing Quantity, stock Volume, or Flow of Funds Indicators provides the complete set of indicator analysis to determine the direction of the Breakout when using Bollinger Bands. The chart example above has stock Volume and Quantity Indicator windows below price.
LEARN MORE at TechniTrader.Courses
Trade Wisely,
Martha Stokes CMT
TechniTrader technical analysis using a TC2000 chart, courtesy of Worden Bros.
Chartered Market Technician
Instructor & Developer of TechniTrader Stock & Option Courses
Copyright ©2017–2024 Decisions Unlimited, Inc. dba TechniTrader. All rights reserved.
TechniTrader is also a registered trademark of Decisions Unlimited, Inc.