
How to Identify Selling Short Bounce Areas
Determine Levels and Strength of Support
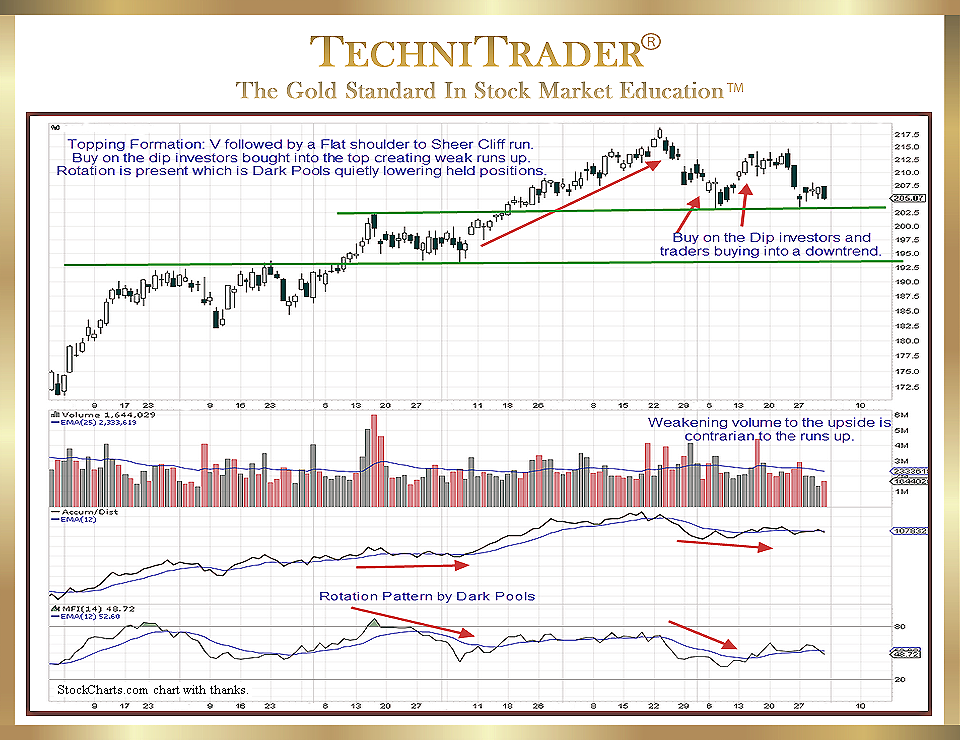
Topping patterns have undergone dramatic changes in the past decade due to Market Structure changes which have created new types of venues, orders, routing, and Market Participants. Once the new topping formations are identified, the next analysis must be where small and minor non-reversal runs (aka bounces) will occur.
Identifying Selling Short bounce areas begins with the first bounce area typically caused by Small-Lot Investors or Retail Traders using the “Buy the Dip” strategy, unaware that they are buying into a technical downtrend.
Identifying Selling Short bounce areas in a downtrend stock is one type of the analysis that all Sell Short Traders need to do prior to Selling Short.
It is also a critical analysis for Position Traders and Long-Term Investors to determine the best exit strategy IF they decide to sell the stock.
Ultimately, selling into a bounce has lower risk for a late exit out of a stock by a Position Trader or a Long-Term Investor.
In the chart example above, ideally these two longer hold groups would already be out by now using tighter trailing profit stops, as the stock revealed topping action.
The top is clearly defined, and where it will encounter Buy the Dip investors and traders is relevant to how and when these two groups buy, which is usually percentage-based.
The downside of the market is predominantly Technical Traders using Sell Short techniques, Stop Losses being hit, and Dark Pool Quiet Rotation™ by the Giant Funds’ hidden Dark Pools.
LEARN MORE at TechniTrader.Courses
Trade Wisely,
Martha Stokes CMT
TechniTrader technical analysis using a StockCharts chart, courtesy of StockCharts.com
Chartered Market Technician
Instructor & Developer of TechniTrader Stock & Option Courses
Copyright ©2015–2024 Decisions Unlimited, Inc. dba TechniTrader. All rights reserved.
TechniTrader is also a registered trademark of Decisions Unlimited, Inc.