
What Is the Best Candlestick Pattern for Stock Trading?
Chart Examples Show Pattern with Buy Entry Signal
The goal for your trading should be to learn how to find the best stocks to trade quickly and easily. Oftentimes, traders spend more time trying to figure out which stock they should choose to trade and waste most of their day looking at stock charts. Candlestick chart example #1 below has a strong Buy Entry Signal, which is one of the best patterns for stock trading.
It is one of many entry signals that are taught exclusively at TechniTrader. This is an extremely reliable Beginning Trader Candlestick Pattern which provides low risk and high profit potential.
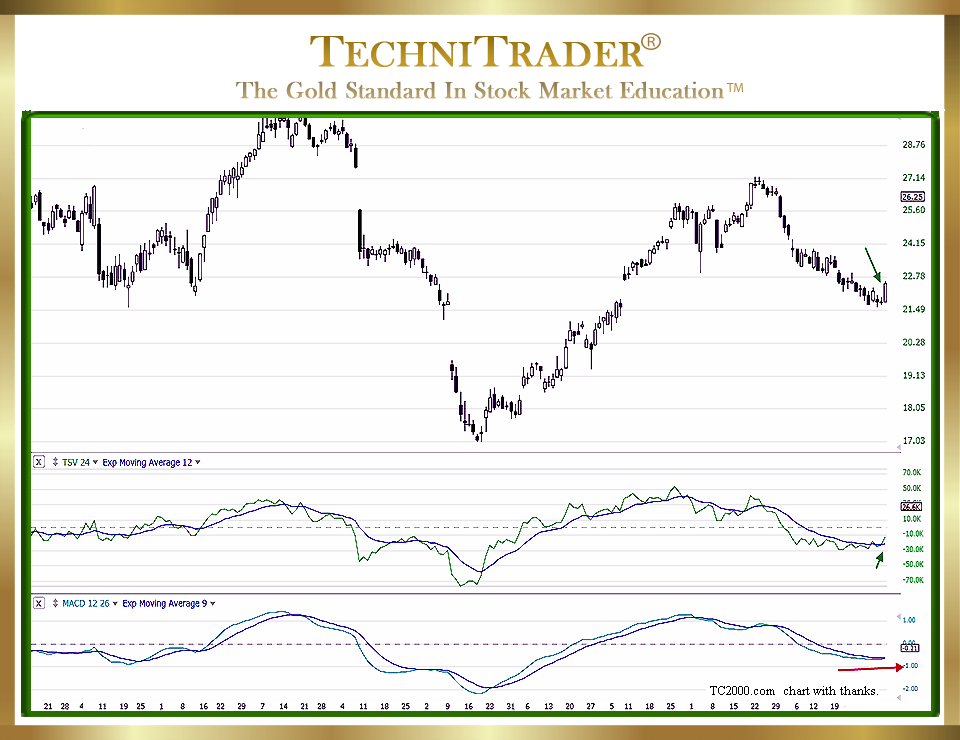
The proper indicators are needed to confirm this Buy Entry Signal as having sufficient underlying HIDDEN large-lot buying activity by giant Buy Side Institutions. At some point, their buying will trigger High Frequency Traders’ (HFTs’) computer algorithms to run or gap up this stock. In the top indicator window below price, see that the Time Segmented Volume (TSV) indicator reveals giant Buy Side Institutions using Dark Pools to buy large lots of shares incrementally. Their buying is hidden off the exchanges, but this indicator confirmation makes this Buy Entry Signal one of the best Candlestick Chart Patterns for Stock Trading.
This is not an Entry Signal taught in the standard candlestick books. It is the group pattern of five candlesticks in this chart example that is the differentiator, with the size and placement of those five candlesticks making this a strong Buy Entry Signal.
As you can see in the bottom chart window, MACD has no signal at all. It is floating on the downside since it can only cross over AFTER price has moved and because it is a Momentum Price Indicator. In addition, it has no ability to track large-lot accumulation by the giant Buy Side Institutions. MACD finally crosses over, but only after the stock has gapped up. This is a High Frequency Trading gap, and the run is finished at this point. Candlestick chart example #2 shows what happened next after the strong Buy Entry Signal.
LEARN MORE at TechniTrader.Courses
Trade Wisely,
Martha Stokes CMT
TechniTrader technical analysis using TC2000 charts, courtesy of Worden Bros.
Chartered Market Technician
Instructor & Developer of TechniTrader Stock & Option Courses
Copyright ©2017–2024 Decisions Unlimited, Inc. dba TechniTrader. All rights reserved.
TechniTrader is also a registered trademark of Decisions Unlimited, Inc.