Why Learn Dark Pool Candlestick Patterns?
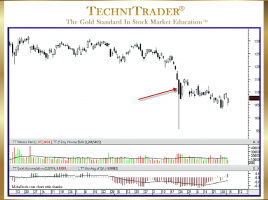
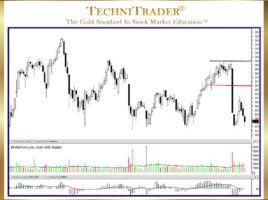
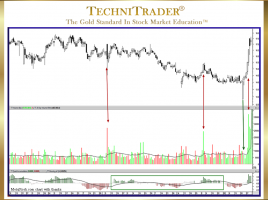
To Enter Stocks Prior to Velocity Runs Dark Pools use precise controlled orders that trigger automatically over extended periods of time. Since the Buy Side Institutions using the Dark Pools are primarily buying for the long term, price can sometimes drop down before moving up. This tendency often leaves Retail …