Currently browsing tag

sideways candlestick pattern

How to Identify Topping Action with Bollinger Bands®

Use Bollinger Bands with Quantity Indicators Bollinger Bands are an outstanding indicator for analyzing sideways candlestick patterns. The bands’ ability to expand and contract revealing the amplitude of price is a critical factor for accurately identifying breakout action before price moves up or down. Use Bollinger Bands topping action to …

How to Identify Downside Breakouts Prior to a Top

Recognize Shift of Sentiment™ Patterns in Indicators One of the more frustrating patterns for many Technical Traders and Retail Traders are the Flat Top Candlestick Patterns that form today. These new Topping Formations surprise many traders and result in whipsaw trades and losses with breakouts to the downside. What appears …

How to Enter Lower-Priced Stocks

Recognizing Stock Bottoms with Strong Support All too often, new Individual Investors and Retail Traders see a fast-running stock nearing a topping candlestick pattern, and they rush to buy it because it has been running up for so long. It looks as if the stock is never going to stop, …

What Is the Power in Platform Candlestick Patterns?

Buy Side Institutions Buying in Dark Pools Prior to Runs The “Platform Candlestick Pattern” is a relatively new sideways candlestick pattern that is becoming more and more prevalent as the Dark Pools’ activity increases. Dark Pools are Alternative Trading System (ATS) venues that transact giant-lot orders off of the Exchanges. …

How to Trade Stocks Profitably for Beginners

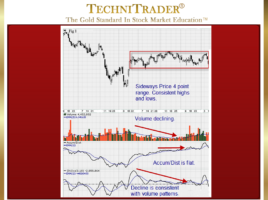
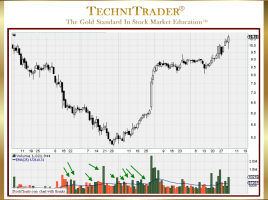
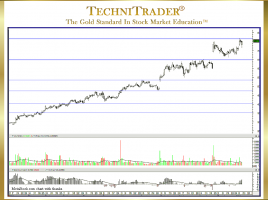
Precise Sideways Price Action Means Buyers Are Dominant Most Individual Investors and Retail Traders do not realize that they have a huge advantage over the professional side of the market. This is due to the constraints, restrictions, rules, and regulations the professional side must comply with on an ongoing basis. …

2 pages