Currently browsing tag

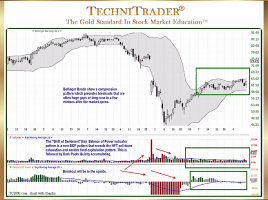
Quiet Accumulation

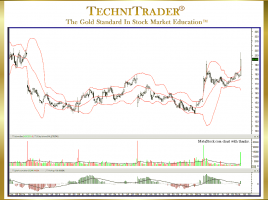
How to Improve Bollinger Bands®

Add Quantity Indicators to Analysis for Stock & Options Trading One of the most exasperating things that happen to Retail Traders and Technical Traders is to find a chart with a perfect setup but the stock has already gapped or ran up with a huge one-day gain, as High Frequency …

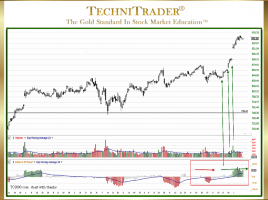
Why Use Balance of Power to Find Dark Pools?

For Identifying Stocks Poised for Momentum Runs Balance of Power (BOP) is an extremely rare and unique indicator. Its origins come from the professional side of the market. It is designed to separate out large-lot activity from small-lot activity. This kind of stock volume aka quantity analysis on the tick-by-tick …

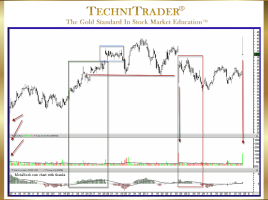
How to Use Dark Pools for Higher Profits

Identify Quiet Accumulation Candlestick Pattern Before Stock Runs An area of Technical Analysis that has not made its way into most Stock Market books, articles, and information available on the internet is how to use Dark Pools for higher profits. The reason why Dark Pool technical patterns aka footprints are …

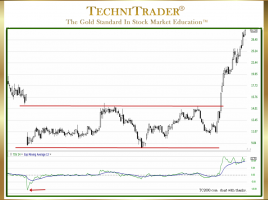
Why Does Time Segmented Volume Indicator Lead Price?

Has a Unique Cumulative Formula Rather Than Average-Based Time Segmented Volume (TSV) is a rare stock Volume Oscillator which provides leading indicator signals that are invaluable to short-term trading of stocks. Applicable styles of trading include Swing Trading, Momentum Trading, Position Trading, and Day Trading. As the Market Structure has …

Why Recognize MACD Contrarian Indicator Patterns?

Sideways Candlestick Pattern Breakout Direction Oftentimes, traders may be confused with conflicting indicator patterns. Contrarian patterns between indicators and between Price and stock Volume-based Indicators are very common these days. In the stock chart example below, the stock gapped up on earnings news and shifted to a sideways candlestick pattern …

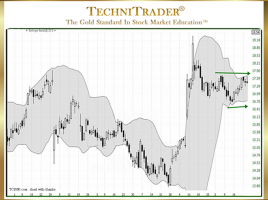
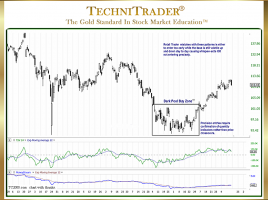
What Is the Power in Platform Candlestick Patterns?

Buy Side Institutions Buying in Dark Pools Prior to Runs The “Platform Candlestick Pattern” is a relatively new sideways candlestick pattern that is becoming more and more prevalent as the Dark Pools’ activity increases. Dark Pools are Alternative Trading System (ATS) venues that transact giant-lot orders off of the Exchanges. …

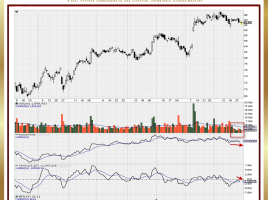
How to Find Swing Trading Style Runs

Identify Momentum & Velocity Market Conditions Using Indicators When the Stock Market moves with plenty of momentum and velocity activity, it provides opportunities for Swing Traders to hold a trade through a 1–10 day run up and then exit before the stock encounters profit taking. Below is a stock chart …

2 pages