Currently browsing tag

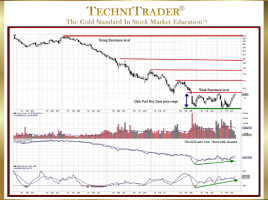
Dark Pool Buy Zone

How Does Stock Fundamental Support Form?

By Dark Pool Candlestick Pattern Platforms Fundamental Investors and Traders are the Buy Side Institutions, who use Dark Pools to buy and sell large to giant lots and block orders. Often trading short-term are the Sell Side Institutions and Smaller Funds. Small-Lot Retail Investors are negligible and tend not to …

How to Use Balance of Power Indicator Properly

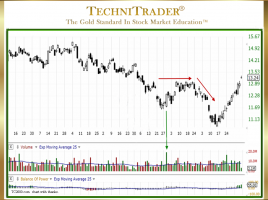
4 Tips Include Indicator Bar Length & Color TC2000 Users have a huge advantage over traders who do not use this charting program. Unfortunately, most TC2000 Users are not taking full advantage of the tools embedded in this program. One of the many tools that are unique to TC2000 is …

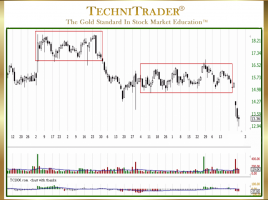
Why Learn Dark Pool Candlestick Patterns?

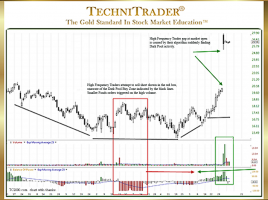
To Enter Stocks Prior to Velocity Runs Dark Pools use precise controlled orders that trigger automatically over extended periods of time. Since the Buy Side Institutions using the Dark Pools are primarily buying for the long term, price can sometimes drop down before moving up. This tendency often leaves Retail …

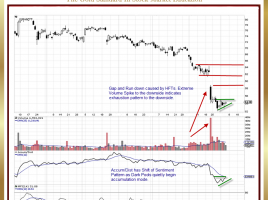
Why Use Balance of Power to Find Dark Pools?

For Identifying Stocks Poised for Momentum Runs Balance of Power (BOP) is an extremely rare and unique indicator. Its origins come from the professional side of the market. It is designed to separate out large-lot activity from small-lot activity. This kind of stock volume aka quantity analysis on the tick-by-tick …

How to Go Beyond Basic Candlestick Pattern Analysis

Recognizing Who Is Controlling the Stock Price There is a plethora of analysis training on Candlestick Patterns and interpretation, and yet this remains one of the most problematic areas for Technical Traders who want to trade at the expert level earning high income from just trading stocks. The candlestick chart …

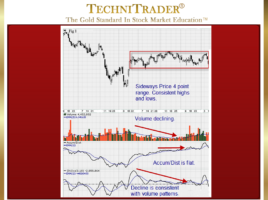
Why Analyze Sideways Bottoming Stock Trends?

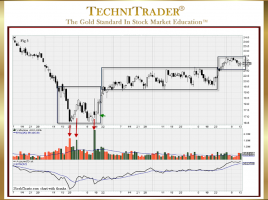
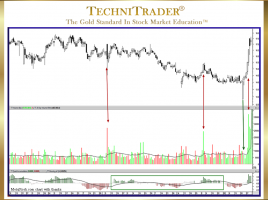
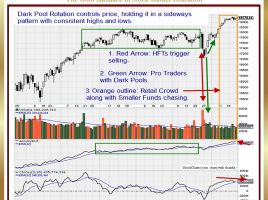
To Identify Dark Pool Buy Zones™ The Shift of Sentiment™ pattern in the stock chart example below clearly and easily shows that Buy Side Institutions using Dark Pools entered this stock and would quickly take control of price. Sideways bottoming stock trend analysis of the chart shows that a sudden …

2 pages