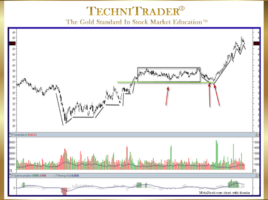
Why Use the TechniTrader® Quiet Accumulation (TTQA) Indicator?
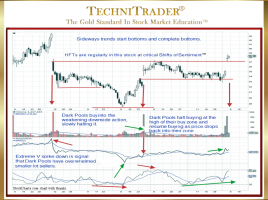
Identify Dark Pools and High Frequency Traders Reading MetaStock Charts is a skill that all traders need to hone and strive to improve constantly. Candlestick price patterns matter. What price is doing reveals a great deal about which Stock Market Participant Groups are controlling price. Who is in control of …