Currently browsing tag

Bollinger Bands

How to Identify Topping Action with Bollinger Bands®

Use Bollinger Bands with Quantity Indicators Bollinger Bands are an outstanding indicator for analyzing sideways candlestick patterns. The bands’ ability to expand and contract revealing the amplitude of price is a critical factor for accurately identifying breakout action before price moves up or down. Use Bollinger Bands topping action to …

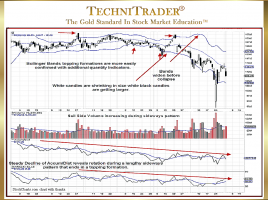
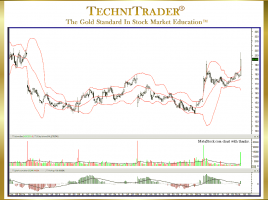
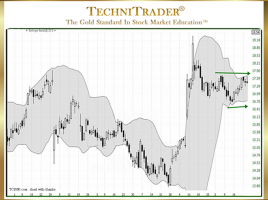
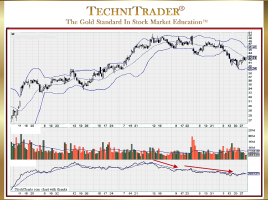
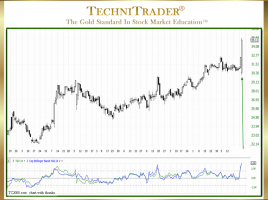
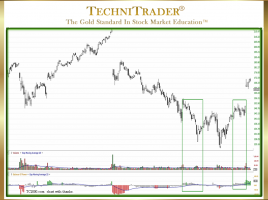
How to Use Bollinger Bands® in MetaStock Charts

Add Stock Volume Indicators for Direction Stock Will Move The Bollinger Bands indicator has been gaining in popularity. This is no surprise, given the changes in the Market Structure and how price behaves with more of the Exchanges, Dark Pool Alternative Trading Systems (ATSs), Electronic Communication Networks (ECNs), and other …

How to Improve Bollinger Bands®

Add Quantity Indicators to Analysis for Stock & Options Trading One of the most exasperating things that happen to Retail Traders and Technical Traders is to find a chart with a perfect setup but the stock has already gapped or ran up with a huge one-day gain, as High Frequency …

Why Use Balance of Power Hybrid Stock Indicator?

So Powerful It Reveals Dark Pools in the Automated Markets There is one critical factor that separates highly successful traders from those who struggle with mediocre returns. It is the awareness of how new Alternative Trading System (ATS) venues, new order processing, and new algorithms have forever changed how stocks …

Why Is There Clarity Using Bollinger Bandwidth® Indicator?

A Technique for Better Bollinger Bands® Analysis Bollinger Bands are by far one of the best indicators for analysis of sideways price action in stocks, finding compression patterns early before High Frequency Trading price surges and providing visual assistance with Spatial Pattern Recognition Skills™ (SPRS) for Beginner Traders. However, using …

2 pages