Currently browsing tag

Day Trading

Indicators for Earnings Report Trading Strategies

Trade Earnings by Tracking Professional Traders & High Frequency Traders Earnings Season provides plenty of strong momentum runs for Swing and Day Traders. However, many traders struggle with determining how the stock will move on the day of the report release. To succeed at finding Professional Traders’ footprints before an …

How to Go Beyond Basic Candlestick Pattern Analysis

Recognizing Who Is Controlling the Stock Price There is a plethora of analysis training on Candlestick Patterns and interpretation, and yet this remains one of the most problematic areas for Technical Traders who want to trade at the expert level earning high income from just trading stocks. The candlestick chart …

What Is Dark Pool Quiet Rotation™?

Candlestick Patterns Explained with Stock Indicators Most Technical and Retail Traders have heard about Buy Side Institutions’ Dark Pool Quiet Accumulation and Quiet Distribution, but few understand another institutional action which is Dark Pool Quiet ROTATION. The candlestick chart example below with a monthly view shows the commencement of a …

How to Identify High Frequency Traders and Dark Pools

Learn Price and Stock Volume Analysis When the Financial Markets undergo massive internal and structural changes, those changes impact price and stock volume action that Retail Traders depend upon due to their use of charts and technical indicators for stock pick selection and trading. See the candlestick chart example below. …

How to Find the Giant Buy Side Institutions

Identify Platform Candlestick Patterns for Low Risk & Early Entry The giant Buy Side Institutions control vast amounts of money on behalf of their fundholders. They are the giant Mutual Funds and Pension Funds in the US and around the world. Most of the time, Individual Investors and Retail Traders …

Day Trading vs. Position Trading Stocks Comparison

Differences in Styles, Costs, and Profits Day Trading is the most widely talked about Trading Style for Retail Traders. However, it is the least profitable of all the short-term Trading Styles. This is a little-known fact that no one ever tells Retail Traders when they start to learn to trade …

What Is Missing in Your Risk Analysis?

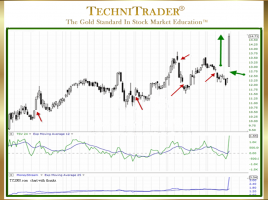
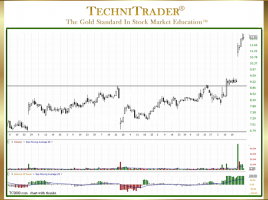
Stop Loss with Support & Resistance The least used and most often improperly used analysis by Technical Traders and Retail Traders is Risk Analysis. All too often, traders are choosing high-risk stock picks without realizing it. See the candlestick chart example below. This analysis is NOT using percentages, but rather …