Currently browsing tag

Technical Analysis

How to Use Balance of Power Indicator Properly

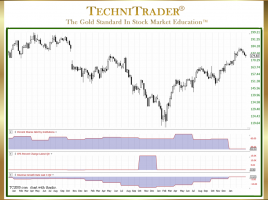
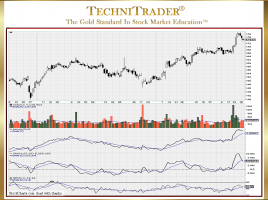
4 Tips Include Indicator Bar Length & Color TC2000 Users have a huge advantage over traders who do not use this charting program. Unfortunately, most TC2000 Users are not taking full advantage of the tools embedded in this program. One of the many tools that are unique to TC2000 is …

Which Stock Indicators Drive Profits?

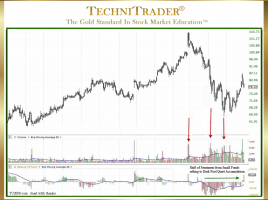
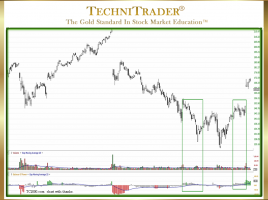
Quantity Defines Many Aspects of the Trade There are massive internal and hidden Market Structure changes going on. Using ALL of the Data available from the markets is imperative for reliable and highly profitable trades. There is often confusion regarding the least-used Data Set for stock indicators, which is QUANTITY. …

Why Use Balance of Power Hybrid Stock Indicator?

So Powerful It Reveals Dark Pools in the Automated Markets There is one critical factor that separates highly successful traders from those who struggle with mediocre returns. It is the awareness of how new Alternative Trading System (ATS) venues, new order processing, and new algorithms have forever changed how stocks …

How to Identify High Frequency Trader Activity

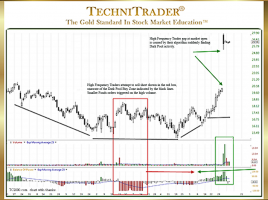
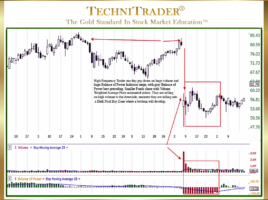
List Provided to Recognize Their Candlestick Patterns High Frequency Trader (HFT) activity occurs often these days, and the HFT candlestick patterns are substantial but unsustainable. Retail Traders who want to learn how to Sell Short during topping markets and downtrends need to be able to identify the “footprints” of the …

What Is Advanced Technical Analysis of Candlestick Charts?

List of Tips for Choosing High-Quality Stock Picks Advanced Technical Analysis of Candlestick Charts for Trading Stocks gives you more opportunities to trade high-quality stock picks that earn more profits per trade. The goal with every trade you make should be higher profits per trade. Taking pennies for profit on …

What Is the Anatomy of a Swing Trade?

Identifying Large Lots Dominating Buy Side or Sell Side of Momentum Run The most common mistake Retail Traders make in choosing stocks for Swing Trading is to not identify whether the large lots are dominating the buy side or the sell side during the price action momentum run upward. This …

How to Use Dark Pools for Higher Profits

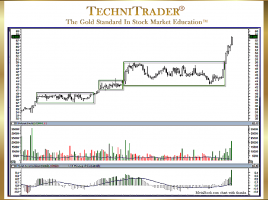
Identify Quiet Accumulation Candlestick Pattern Before Stock Runs An area of Technical Analysis that has not made its way into most Stock Market books, articles, and information available on the internet is how to use Dark Pools for higher profits. The reason why Dark Pool technical patterns aka footprints are …

Why Recognize MACD Contrarian Indicator Patterns?

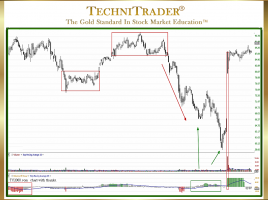
Sideways Candlestick Pattern Breakout Direction Oftentimes, traders may be confused with conflicting indicator patterns. Contrarian patterns between indicators and between Price and stock Volume-based Indicators are very common these days. In the stock chart example below, the stock gapped up on earnings news and shifted to a sideways candlestick pattern …

3 pages