Currently browsing tag

Market Participant Groups

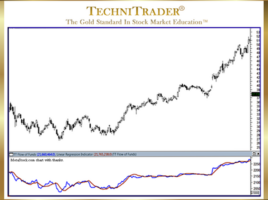
How to Use Balance of Power for Early Entry into Stocks

Shift of Sentiment™ Signals Momentum Energy Is About to Occur TC2000.com Users have a huge advantage over other Retail Traders as they have access to 3 of the most powerful indicators for the markets today which are automated with multi-venues for Stocks and Options. The complexity of the modern markets …

How to Read a Candlestick Chart for Stock Trading

List of 5 Tips About Price Action Revealed A skill that all traders need to hone and strive to improve constantly is how to read a candlestick chart for stock trading. Candlestick patterns of price action matter. What price is doing tells a great deal about which Stock Market Participant …

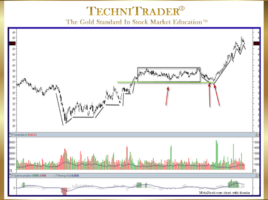
How to Position Trade Bottoming Stocks

List of 5 What to Recognize in Candlestick Patterns Many traders do not have the time or resources to trade the most well-known Trading Styles, which are Day Trading and Swing Trading. Both of these styles require more time, a higher capital base, and the ability to be trading in …

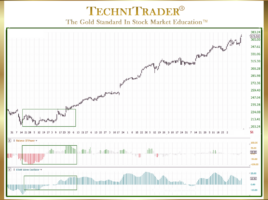
Why Use Contrarian Patterns for Stock Top Warning?

Indicators Reveal Giant Institutions Rotating Out as Price Moves Up Often for Beginners, the market reversing and heading down into a correction is a complete surprise or shock. They are not expecting the turn, nor are they prepared for it. Fortunately for Retail Traders, there are plenty of indicators that …

What Are the 5 Key Aspects of Technical Analysis?

Candlestick Patterns Reveal Who, What, Where, When, and Why Technical Analysis is the study and interpretation of price, time, and stock volume for stocks and indexes. Due to the massive changes to the Stock Market Structure since the Banking Debacle and Subprime Mortgage disaster, Technical Analysis has been evolving and …

2 pages