Currently browsing tag

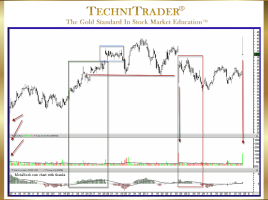
Dark Pool Quiet Accumulation

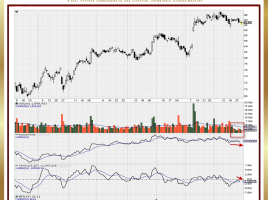
Why Recognize MACD Contrarian Indicator Patterns?

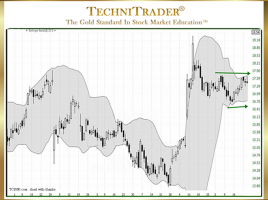
Sideways Candlestick Pattern Breakout Direction Oftentimes, traders may be confused with conflicting indicator patterns. Contrarian patterns between indicators and between Price and stock Volume-based Indicators are very common these days. In the stock chart example below, the stock gapped up on earnings news and shifted to a sideways candlestick pattern …

What Is the Power in Platform Candlestick Patterns?

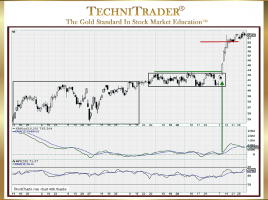
Buy Side Institutions Buying in Dark Pools Prior to Runs The “Platform Candlestick Pattern” is a relatively new sideways candlestick pattern that is becoming more and more prevalent as the Dark Pools’ activity increases. Dark Pools are Alternative Trading System (ATS) venues that transact giant-lot orders off of the Exchanges. …

How to Find the Giant Buy Side Institutions

Identify Platform Candlestick Patterns for Low Risk & Early Entry The giant Buy Side Institutions control vast amounts of money on behalf of their fundholders. They are the giant Mutual Funds and Pension Funds in the US and around the world. Most of the time, Individual Investors and Retail Traders …

How to Position Trade Bottoming Stocks

List of 5 What to Recognize in Candlestick Patterns Many traders do not have the time or resources to trade the most well-known Trading Styles, which are Day Trading and Swing Trading. Both of these styles require more time, a higher capital base, and the ability to be trading in …

Why Use Inverted Technical Analysis™?

Determine If a Stock Is a Retracement or Sell Short When Retail Traders are already in a stock and it starts to move down rather than up, many do not know whether to sell the stock or hold it. They are uncertain whether the move down is just a retracement …

3 pages