Currently browsing tag

platform

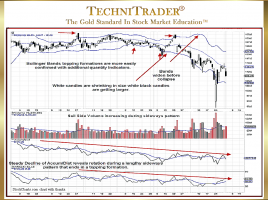
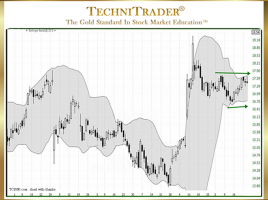
How to Identify Topping Action with Bollinger Bands®

Use Bollinger Bands with Quantity Indicators Bollinger Bands are an outstanding indicator for analyzing sideways candlestick patterns. The bands’ ability to expand and contract revealing the amplitude of price is a critical factor for accurately identifying breakout action before price moves up or down. Use Bollinger Bands topping action to …

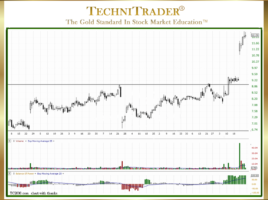
Why Is There Burgeoning Success of Position Trading?

It Is a Reliable Low-Risk Entry Trading Style Position Trading is a newer Trading Style that most people haven’t heard about, unless they are a TechniTrader Student. I developed this Trading Style for choppy Sideways Market Conditions. More and more of the Large and Giant Funds Managers have moved their …

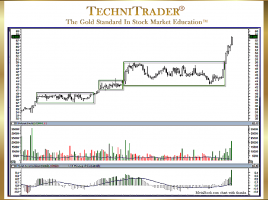
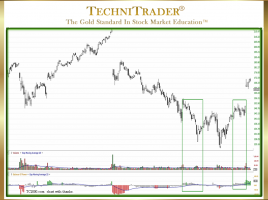
How Does Stock Fundamental Support Form?

By Dark Pool Candlestick Pattern Platforms Fundamental Investors and Traders are the Buy Side Institutions, who use Dark Pools to buy and sell large to giant lots and block orders. Often trading short-term are the Sell Side Institutions and Smaller Funds. Small-Lot Retail Investors are negligible and tend not to …

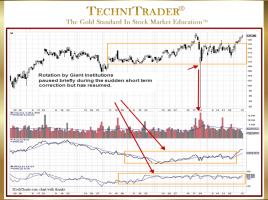
Why Use Balance of Power Hybrid Stock Indicator?

So Powerful It Reveals Dark Pools in the Automated Markets There is one critical factor that separates highly successful traders from those who struggle with mediocre returns. It is the awareness of how new Alternative Trading System (ATS) venues, new order processing, and new algorithms have forever changed how stocks …

How to Identify Selling Short Bounce Areas

Determine Levels and Strength of Support Topping patterns have undergone dramatic changes in the past decade due to Market Structure changes which have created new types of venues, orders, routing, and Market Participants. Once the new topping formations are identified, the next analysis must be where small and minor non-reversal …

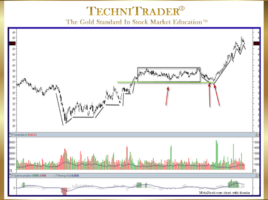
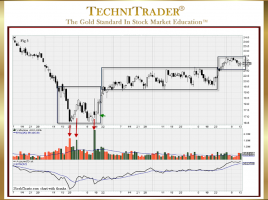
Why Are Platform Candlestick Compressions Ideal Entries?

Stock Is Under Dark Pool Quiet Accumulation Platform Candlestick Compressions ideal entries are best for Swing and Momentum Traders, but identifying these compression patterns early is most important. The chart example below is for studying a Relational Technical Analysis™ pattern. This stock was under Dark Pool Quiet Accumulation, which tends …

2 pages