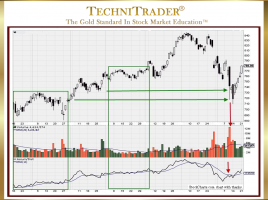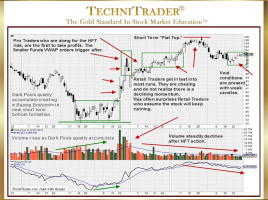
Why Are Favorite Technical Chart Patterns No Longer Reliable?
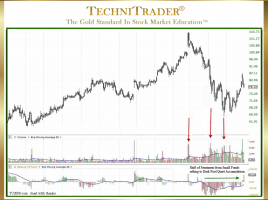
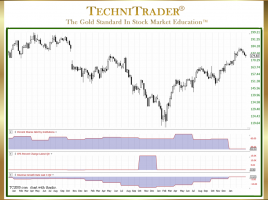
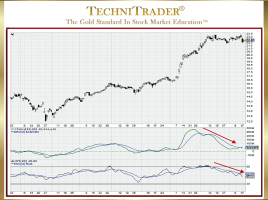
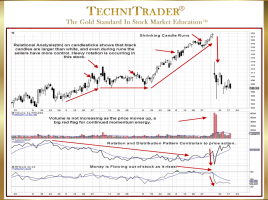
Market Structure Has New Stock Order Types & Venues Many traders are complaining that their favorite Technical Candlestick Patterns no longer work or that they work some of the time but fail more often than not. Technical Traders who have relied upon Technical Analysis patterns that were identified, named, and …