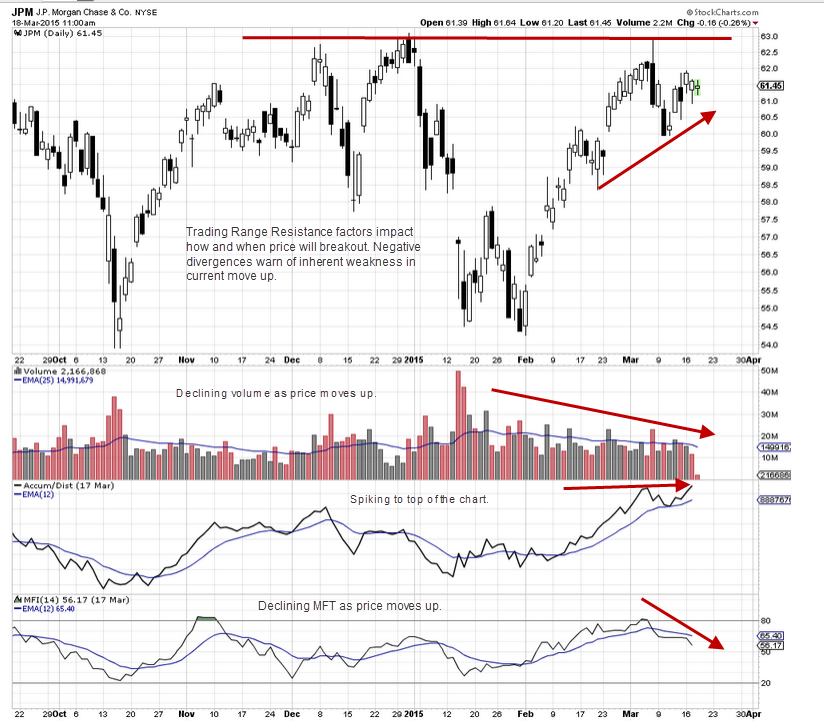
Trading Range Resistance Analysis
How Price and Volume Reflect Resistance Strength
Support and Resistance are hugely important to retail and technical traders who are seeking to take advantage of the sudden velocity moves out of Trading Ranges and other sideways price action. Learning to identify when the price and volume patterns are showing sufficient strength for a breakout move, are critical to anticipating and being ready ahead of time for velocity price action as the stock compresses.
The strength of resistance levels alters based on current Market Conditions, sentiment shifts, and who is in control of price. Resistance levels can at times be blasted through with ease and speed as price accelerates due to High Frequency Traders (HFTs), Professional Traders, and other larger-lot activity. Resistance can also stall a stock indefinitely with fake breakout signals, that over eager retail traders misinterpret with the results being a loss due to whipsaw as the stock rises into the resistance level.
Sometimes a stock will run up just slightly beyond a strong resistance level, which retail traders mistake as a true breakout rather than a fake breakout. This too causes problems and losses.
On the other hand, if a trader waits too long then the velocity run is underway before they are able to enter. Getting in late can also cause whipsaw action and losses as HFTs and Professional traders start selling as retail traders are buying in late in the run.
Seeing when the price and volume patterns are both harmonious and strengthening gives retail traders a huge advantage. It gives them time to plan and calculate their ideal entry, buying into the breakout before the stock is being run up by huge HFT volume.
The first step is to use indicators that are not just price and time indicators. Momentum indicators are primarily price and time indicators, and the price must move before those indicators will signal a go.
The more important indicators for determining when price will have sufficient energy and momentum behind it to push through resistance, comes from indicators that reveal Dark Pool buying and Professional trader footprints. These indicators are far fewer than the traditional price and time indicators, but in the automated marketplace of today they are crucial to successful short term trading.
Regardless of a trader’s preferred short-term trading style whether Swing, Day, Intraday, or Position using quantity and large-lot versus small-lot indicators will provide the additional analytical tools needed to see the increasing energy into the stock before a breakout occurs.
Price alone is not enough to identify strong breakout stocks versus weak fake breakouts, that will collapse shortly after breaching the prior highs of that resistance level.
Summary
As of the date of the chart above, the volume and quantity indicators are showing the energy beneath the price action is weak. A run up therefore has higher risk of reversing quickly rather than developing a true breakout to a new price level.
Incorporating additional indicators into your analysis along with MACD, Average Directional Index ADX, or Bollinger Bands® would be well worth the time with higher profitability and fewer losing trades.
I invite you to visit my website at www.TechniTrader.Courses
Trade Wisely,
Martha Stokes CMT
Chartered Market Technician
Instructor & Developer of TechniTrader Stock & Option Courses
Copyright ©2017–2025 Decisions Unlimited, Inc. dba TechniTrader. All rights reserved.
TechniTrader is also a registered trademark of Decisions Unlimited, Inc.

