Currently browsing author

Martha Stokes CMT

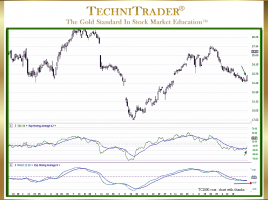
How to Decode a Candlestick Chart with Doji

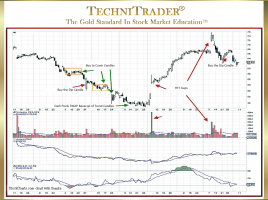
Use Pure Price as Entry & Exit Signals When Candlestick Charts were first introduced to the western markets, everyone using Stock Charts and Technical Analysis relied on indicators more than Bar Charts, which were the most popular charts back then. Bar Charts are much harder to read, give less visual …

STOCK TRADING TRAINING! Beginners start here!

STOCK TRADING TRAINING! Introduction to Trading: Learn How to Trade Stocks Login or Sign Up   TechniTrader The Gold Standard in Stock Market Education™ Trade Wisely, Martha Stokes CMT TechniTrader.Courses Chartered Market Technician Instructor & Developer of TechniTrader Stock & Option Courses Copyright ©2019–2024 Decisions Unlimited, Inc. dba TechniTrader. All …

What Are the 5 Key Aspects of Technical Analysis?

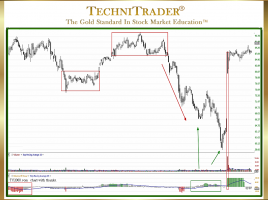
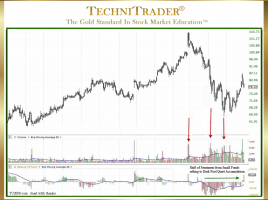
Candlestick Patterns Reveal Who, What, Where, When, and Why Technical Analysis is the study and interpretation of price, time, and stock volume for stocks and indexes. Due to the massive changes to the Stock Market Structure since the Banking Debacle and Subprime Mortgage disaster, Technical Analysis has been evolving and …

What Is Missing in Your Risk Analysis?

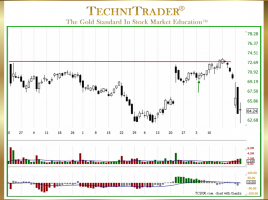
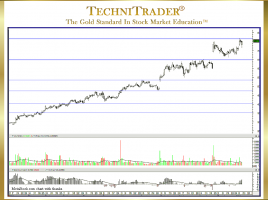
Stop Loss with Support & Resistance The least used and most often improperly used analysis by Technical Traders and Retail Traders is Risk Analysis. All too often, traders are choosing high-risk stock picks without realizing it. See the candlestick chart example below. This analysis is NOT using percentages, but rather …

How to Trade Stocks Profitably for Beginners

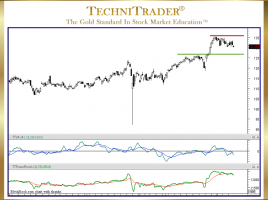
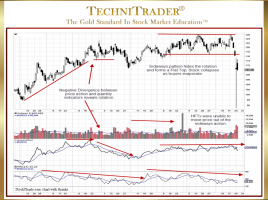
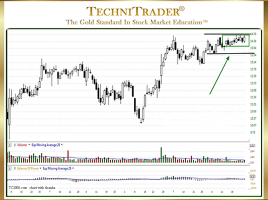
Precise Sideways Price Action Means Buyers Are Dominant Most Individual Investors and Retail Traders do not realize that they have a huge advantage over the professional side of the market. This is due to the constraints, restrictions, rules, and regulations the professional side must comply with on an ongoing basis. …

19 pages