
Why Use Fundamental Stock Indicators for Technical Analysis?
To Find Giant Buy Side Institutions Investing
Technical Analysis is undergoing massive changes as the technologies that support this form of stock analytic continue to expand and become more sophisticated. Charting software is no longer just about price, time, quantity, and symbol. It is also no longer merely candlesticks and stock indicators, but it is becoming a far more useful tool for both Professional Traders and Individual Investors worldwide with Fundamental Stock Indicators for Technical Analysis now available.
With the new more sophisticated capabilities of graphical software products, new analysis techniques must be explored and developed. These provide the Individual Investors and Retail Traders with more advanced analytical tools. As the pace of trading and the variety of instruments increase, it is important to streamline and simplify the entire stock selection process.
Below is a fine example of one of the many new Fundamental Stock Indicators that can be used with Technical Analysis and Fundamental Analysis to improve the selection of stocks, indexes, and Exchange-Traded Funds (ETFs). This is a Weekly Chart View with the Percent Shares Held by Institutions (PSHI) stock chart indicator shown below price.
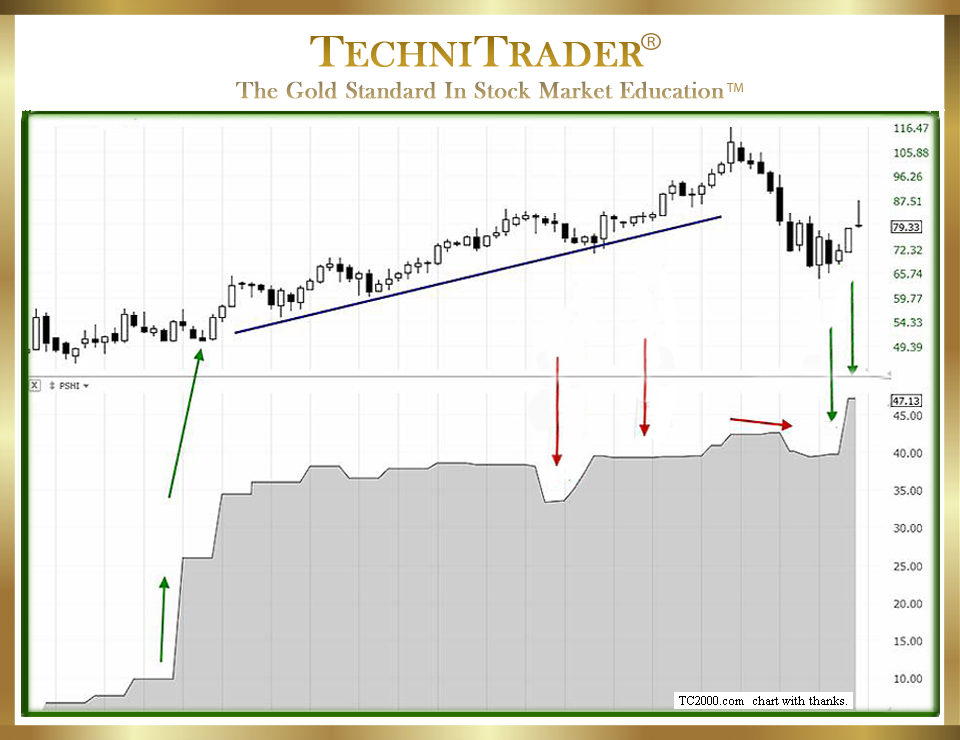
The fundamental Percent Shares Held by Institutions stock chart indicator tracks where institutions are moving into or out of a stock with a Line Indicator. The early huge increase marked by the first green arrow on the left shows that Buy Side Institutions were using Dark Pools to acquire this stock in a Dark Pool Quiet Accumulation mode over many months. The stock climbed for a period of time, but Smaller Funds entered only as the stock peaked and as some Buy Side Institutions started to reduce their held shares.
As the stock declined, High Frequency Traders (HFTs) entered, driving price in big runs downward. This triggered panic in Smaller Funds, which then started selling, causing losses. Retail Traders also bought this stock very late in the uptrend. The subsequent correction is now at the prior Dark Pool Buy Zone™. As the stock forms a bowl-shaped bottom, which can be seen with Dark Pool Quiet Accumulation over time, the High Frequency Traders are suddenly aware of the Dark Pools and trigger long candlesticks to the upside.
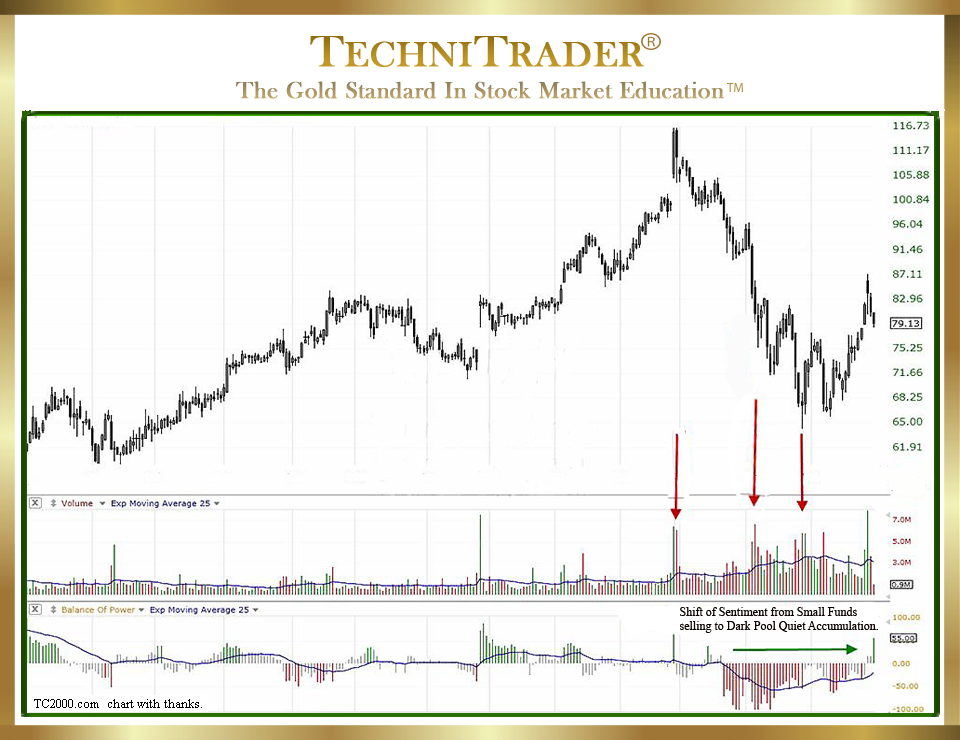
Below is the same stock chart, this time showing the use of stock Volume in the middle chart window and the Balance of Power indicator with a Shift of Sentiment™ in the bottom chart window. This is a Daily Chart View.
The use of Fundamental Stock Indicators for Technical Analysis is one of the most exciting new areas of development for both the fundamental and technical Professional Traders and Individual Investors, with the ability now to integrate most of the essential fundamentals and even many financial aspects into a graphical chart form that is as easy to analyze as stock indicators. With fundamental data now part of the best charting software systems, Individual Investors and Retail Traders are no longer hampered by the lack of transparency for the fundamental side of the market, which constitutes more than 75% of all Stock Market Participants.
Conversely, with technical data reaching new levels of sophistication, a new approach is being adopted by many Fundamentalists.
Integrating both fundamental and some technical data into their stock selection process immediately provides greater transparency for Risk Analysis and assessment, as well as the monitoring of the Stock Market Participants active in that stock.
LEARN MORE at TechniTrader.Courses
Trade Wisely,
Martha Stokes CMT
TechniTrader technical analysis using TC2000 charts, courtesy of Worden Bros.
Chartered Market Technician
Instructor & Developer of TechniTrader Stock & Option Courses
Copyright ©2017–2024 Decisions Unlimited, Inc. dba TechniTrader. All rights reserved.
TechniTrader is also a registered trademark of Decisions Unlimited, Inc.