How to Interpret Stock Sideways Candlestick Patterns
Tips to Identify Them & List of How They Are Different
There are hundreds of strategies that have been developed for sideways action, but Technical Traders and Retail Traders still have meager gains or chronic losses during Sideways Stock Market Conditions. This is an important trend to master as the markets now trend sideways more than 60% of the time, often in patterns that are not recognized as sideways.
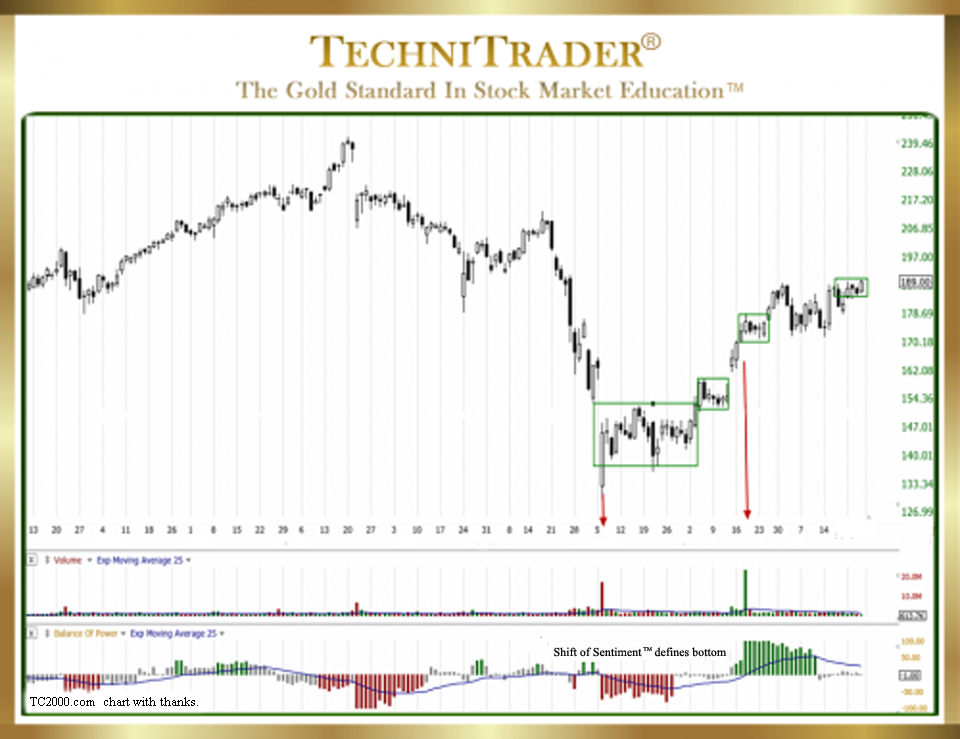
Below is a chart example using a weekly view showing the type of analysis that all traders need to be capable of doing within seconds of seeing a chart.

This chart has a short-term Bottom Formation that is sideways called a “Basing Bottom” stock formation, and it is one of the newer bottoms that form on the short-term trend. The compression out of this bottom creates moderate momentum.
In this chart example, the compression candlestick patterns are occurring after each run, which are lasting an average of 3 days. Candlestick entries are based on resting day action with a “Shift of Sentiment™” on the Accumulation/Distribution indicator. Volume defines High Frequency Trading activity; however, Professional Traders are in control of price in this chart example.
Here are some Tips to Identify Stock Sideways Candlestick Patterns:
- Bottoming Formations are predominantly sideways.
- Topping Formations are also mostly sideways.
- Platform Market Conditions are lengthy sideways action in a tight formation that whipsaws Swing and Day Traders out of potentially good entries.
- Consolidations are common when Professional Traders are actively trading.
LEARN MORE at TechniTrader.Courses
Trade Wisely,
Martha Stokes CMT
TechniTrader technical analysis using a FreeStockCharts chart, courtesy of Worden Bros. and FreeStockCharts.com
Chartered Market Technician
Instructor & Developer of TechniTrader Stock & Option Courses
Copyright ©2017–2025 Decisions Unlimited, Inc. dba TechniTrader. All rights reserved.
TechniTrader is also a registered trademark of Decisions Unlimited, Inc.
