Why Use Wilder’s Relative Strength Index Indicator?
It Is a Price Oscillator Enhanced for the Modern Market
Most traders are very familiar with the standard Price Oscillators which have a high range and a low range. These Price Oscillators are common and found in nearly every charting program. There is Stochastic, Williams %R, Wilder’s Relative Strength Index indicator, and many more oscillators created specifically for determining “Overbought” or “Oversold” conditions.
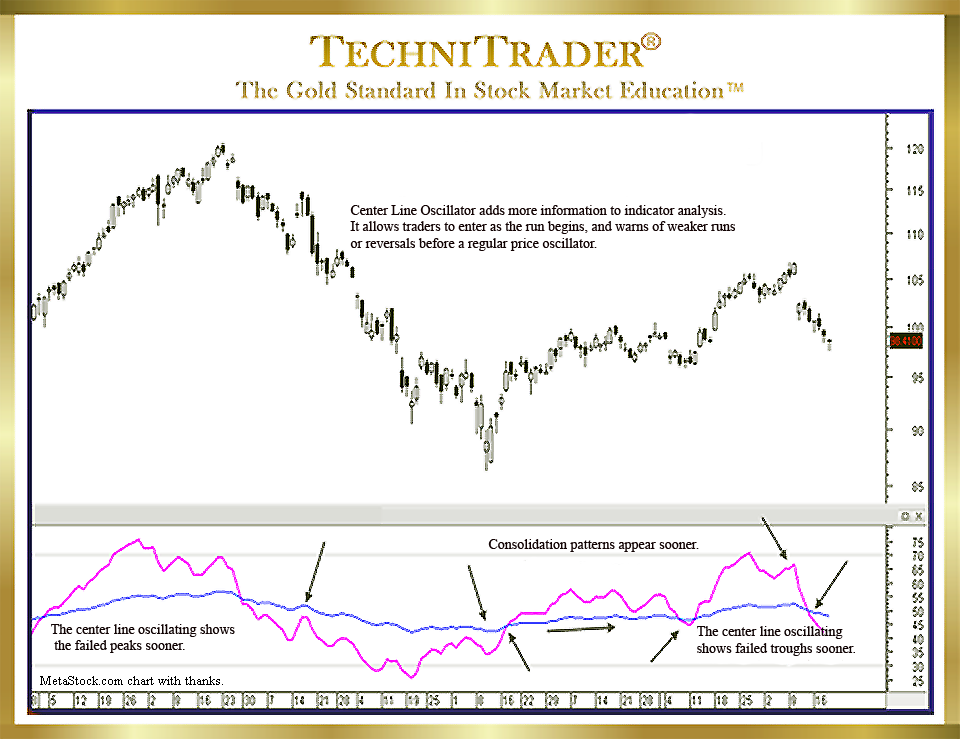
Using stock Volume and Price Oscillators together can be a huge benefit in entering stocks earlier out of bottoms and tops, which are often flat or basing these days, rather than Triple Bottoms or other older-style Bottoming or Topping Patterns you may have been taught. Adding a relational center line that trends with the Price Oscillator can reveal patterns in advance of sudden big moves. See the chart example below.

Wilder’s Relative Strength Index indicator with its one line for oscillation has the most adaptable and easiest patterns to learn when incorporating this kind of Center Line Oscillation into your indicator tool set. It was written in the 1970s and is unique for a Price Oscillator. Instead of just calculating Overbought/Oversold, its formula analyzes current Price action to prior Price action, similar to what many stock Volume Oscillators track. This helps reveal Dark Pool activity, which tends to precede the sudden runs and gaps caused by High Frequency Traders (HFTs). This makes it an invaluable indicator to use for Short-Term Trading.
The Floating Center Line has a softer oscillation, which provides pivotal signals in the Price Patterns. This Hybrid Indicator can be applied to many other Price and stock Volume-based Indicators as well. It provides a three-dimensional as well as a Relational Technical Analysis™ viewpoint that is needed for the more complex Market Structure of today.
LEARN MORE at TechniTrader.Courses
Trade Wisely,
Martha Stokes CMT
TechniTrader technical analysis using a MetaStock chart, courtesy of Innovative Market Analysis, LLC dba MetaStock
Chartered Market Technician
Instructor & Developer of TechniTrader Stock & Option Courses
Copyright ©2017–2025 Decisions Unlimited, Inc. dba TechniTrader. All rights reserved.
TechniTrader is also a registered trademark of Decisions Unlimited, Inc.
