How Is Technical Analysis Changing Fundamental Analysis?
Stock Indicators Transform Data into Histograms or Lines
In the early days of Technical Analysis, Fundamentalists scoffed at the Technical Analysts who claimed that everything about a stock was right there in the stock chart. Price and how it moved was all that really mattered. Fundamentalists argued back that the movement of stocks was a Random Walk or that Technical Analysis was like using a crystal ball rather than corporate financials.
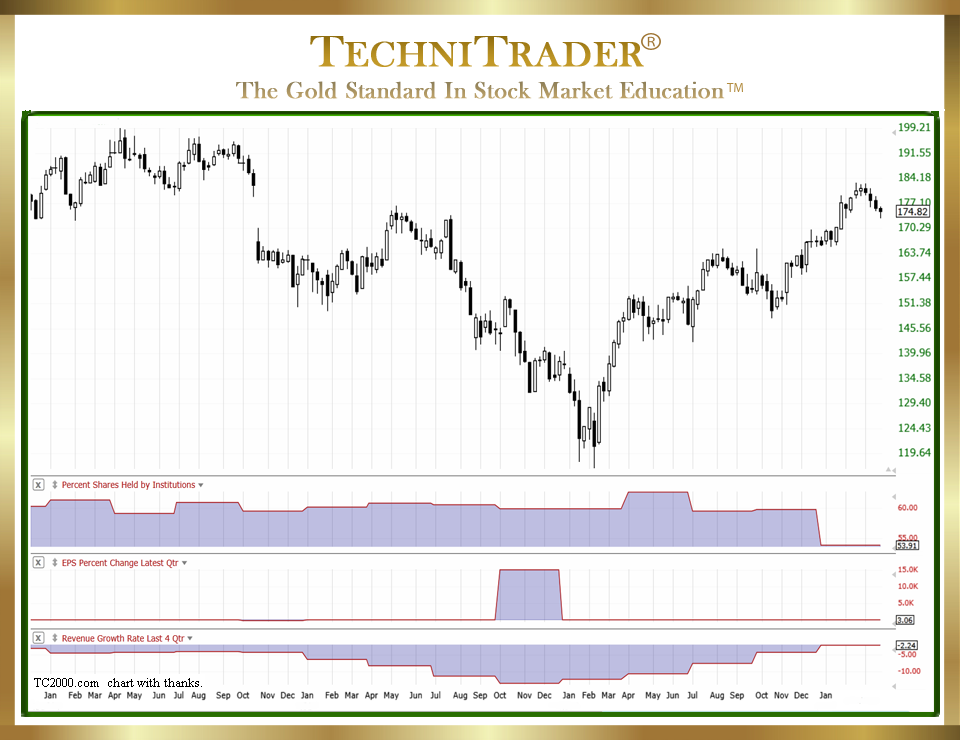
Stock chart example #1 below has 3 new Histogram Fundamental Stock Indicators. This is a monthly view stock chart example with the Percent Shares Held by Institutions, Earnings Per Share (EPS) Percent Change, and Revenue Growth Rate indicators.

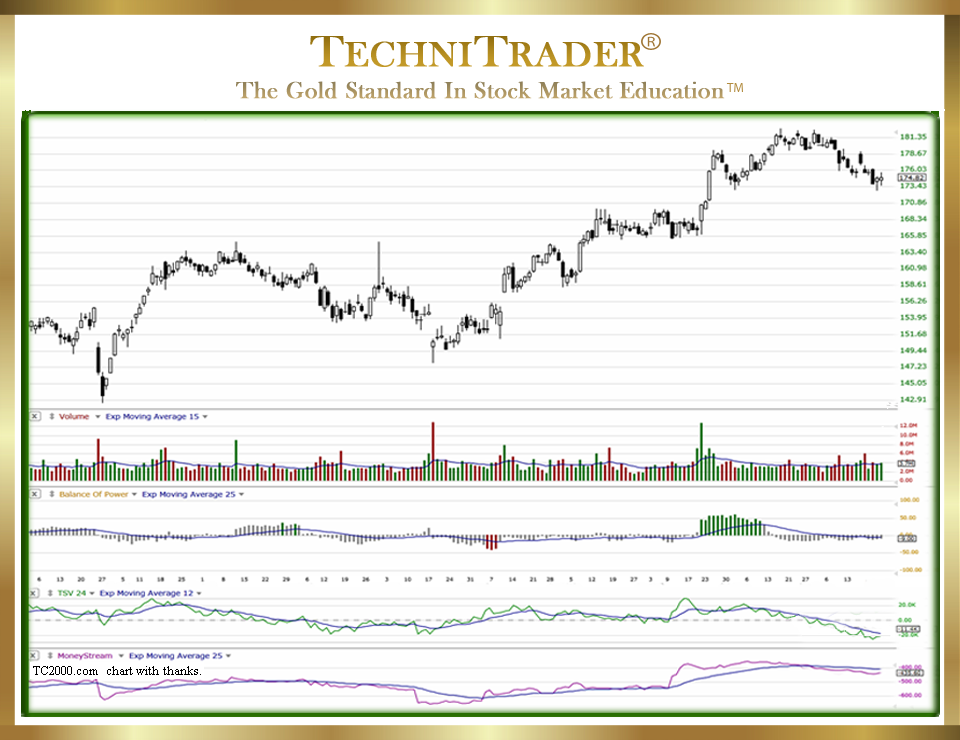
Stock chart example #2 below has Technical Indicators and Fundamental Line Indicators for a better Relational Technical Analysis™. This is a daily view of the same stock chart example with the Balance of Power (BOP), Time Segmented Volume (TSV), and MoneyStream indicators.

Now, Fundamentalists are showing more interest in stock chart Technical Analysis due to the NEW Fundamental Analysis Data Stock Indicators. These convert Fundamentals into a graphical form that is easy to study, analyze, and use WITH Technical Indicators. However, many of the old-school Technical Analysts are scoffing at these indicators as not “Pure Technical Analysis”. This is a rather sad turn of events. All Technical Traders should be excited and embrace any additional data that can be incorporated into stock charts to make choosing stock picks faster, more reliable, and more profitable.
Stock chart indicators can transform data into histograms or lines to make it easier to see what is going on. Whether data is Price, Time, and Quantity OR if it is Percent Shares Held by Institutions, Earnings Per Share Percent Change, and Revenue Growth Rate as Fundamental Line Indicators should be a bonus.
This is the basis of what I call Relational Technical Analysis, and it is the evolution of Technical Analysis.
LEARN MORE at TechniTrader.Courses
Trade Wisely,
Martha Stokes CMT
TechniTrader technical analysis using TC2000 charts, courtesy of Worden Bros.
Chartered Market Technician
Instructor & Developer of TechniTrader Stock & Option Courses
Copyright ©2017–2025 Decisions Unlimited, Inc. dba TechniTrader. All rights reserved.
TechniTrader is also a registered trademark of Decisions Unlimited, Inc.
