
Why Use Chart Trends with Trendline Candlestick Patterns?
New Western Candlesticks Have Entry Signals in Trendline Patterns
Traders learn about Trends Up, Down, and Sideways, which are the commonly taught Trends. There is also the Long-Term Trend (which is sometimes called the Primary Trend), the Intermediate-Term Trend, and the Short-Term Trend. However, few traders learn the Trendline Patterns.
As an example, a very common Trendline Pattern for Swing Trading is the Stairstep Trendline Candlestick Patterns. See the candlestick chart example below.
LEARN MORE at TechniTrader.Courses
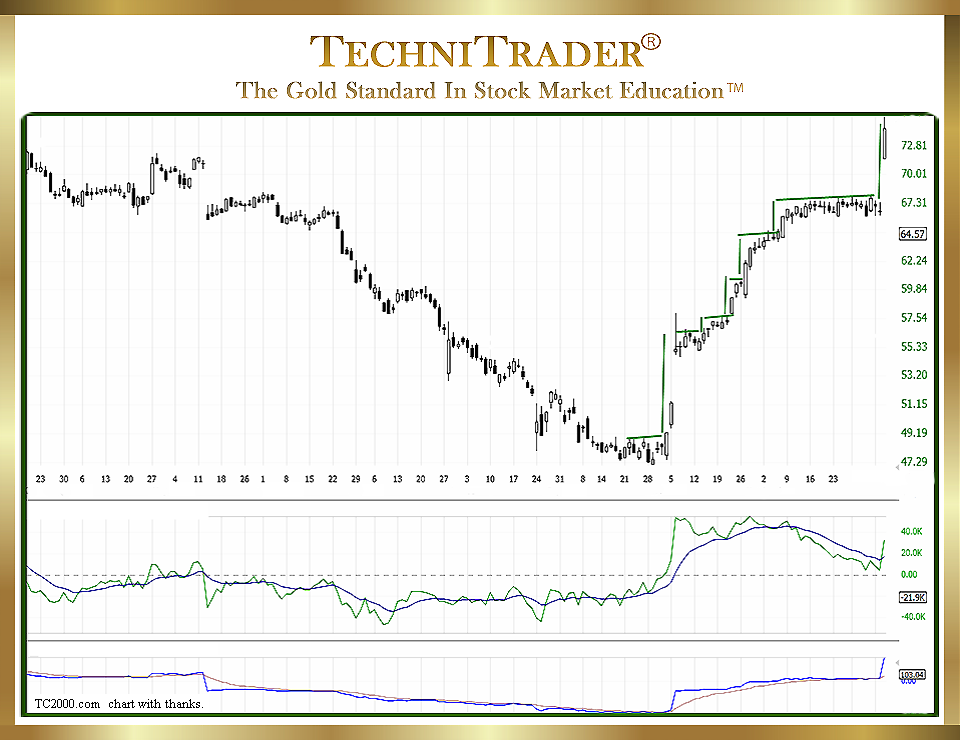
This looks exactly like what the name implies. It only forms on the Short-Term Trend, and it is a Momentum Energy Pattern that is ideal for Swing Trading.
All Chart Trends have Trendline Candlestick Patterns. Each pattern is how price behaves over and over during a period of time when a specific Stock Market Participant Group controls price. These patterns can repeat for a few weeks, a few months, or over a year. All Trendline Patterns change as various Stock Market Participant Groups cease to control price, and a new group takes over.
There can also be periods where one major Stock Market Participant Group disrupts the Trendline Pattern briefly, which are generally called “volatility” or volatile markets.
LEARN MORE at TechniTrader.Courses
Technical Traders and Retail Traders should learn not only the Trends of the Market, but also the 6 Primary Market Conditions. Learning to identify the different Stock Market Trendline Patterns reveals the Stock Market Participant Group or Groups currently controlling price due to the huge or giant group buying or selling.
It then becomes far easier to understand why price has changed, what it means for near-term action, and how this will affect the Candlestick Patterns AND the indicators you prefer to use.
This may all sound very complicated, but in truth, it is simple to learn and very easy to apply. Chart Trends have Trendline Candlestick Patterns that change based on who is controlling price.
There are new Western Candlestick Patterns for Entry Signals that form within the Trendline Pattern in the candlestick chart example above, such as the Resting Day Entry Signal, the Springboard Entry Signal, and the Engulfing White. These new Entry Signal patterns are very reliable for Swing Trading when they form in the Trendline Pattern called Stairstep Trendline Candlestick Patterns.
Summary
Learning the 6 Market Conditions and the Stock Market Participant Groups in addition to Trends and Trendline Patterns provides a more complete picture of what is going on when viewing a stock chart. Recognizing and using the new Western Candlestick Patterns for Entry Signals allows trading to be more reliable and consistent.
LEARN MORE at TechniTrader.Courses
If you have not yet begun to trade or invest, go to Introduction: Learn How to Trade Stocks – Free Video Lesson to get started.
Learn the steps to trade like a pro with this introductory mini course. You will learn what it takes to create a Professional Trading Plan that can help you achieve your trading goals: How to Create a Professional Trading Plan
Trade Wisely,
Martha Stokes CMT
TechniTrader technical analysis using a FreeStockCharts chart, courtesy of Worden Bros. and FreeStockCharts.com
Chartered Market Technician
Instructor & Developer of TechniTrader Stock & Option Courses
Copyright ©2017–2024 Decisions Unlimited, Inc. dba TechniTrader. All rights reserved.
TechniTrader is also a registered trademark of Decisions Unlimited, Inc.