
What Is a Low-Risk Stock Entry Candlestick Pattern?
Bottoming Formation When a Stock Stops a Downtrend
Trading Stocks is becoming an alternative career for many people. It offers a variety of opportunities and advantages that working for a corporation does not. The first step in learning how to trade stocks successfully is to understand what you need to do to trade a stock for short-term profits.
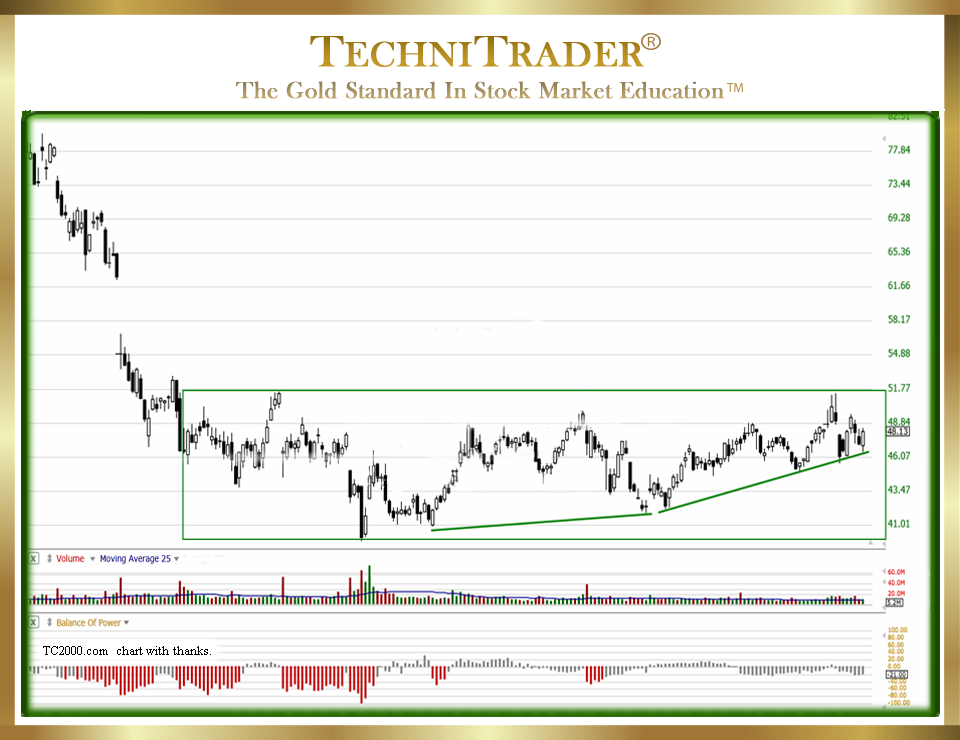
Below is a chart that is showing what is called a “Bottom” or Bottoming Stock Candlestick Pattern Formation, which is when a stock stops a downtrend. This is when it begins a recovery returning to moving in an uptrend, which is what traders want to trade for short-term profits.
LEARN MORE at TechniTrader.Courses
Trading a stock for short-term profits requires finding a stock that is poised to move up in price, but that also has what is called a “low-risk entry”. What is meant by a “low-risk entry” is how the price has moved in recent days.
There are candlestick chart patterns that tell you when a stock is ideal for buying with a low risk.
Risk is calculated by the use of a Stop Loss, which protects your capital and profits should the market suddenly go down.
You will also need to learn how to read a candlestick chart with accuracy. A stock chart is merely a historical set of data that shows how the price moved and how many traders or investors bought the stock during that period of time.
How to trade stocks successfully means you are able to read the chart correctly. It will tell you which Stock Market Participant Groups were buying the stock, and this is critically important information.
The chart above also shows resistance, which is where the stock will either stop moving up and move sideways or retrace which is a brief period of price moving down.
LEARN MORE at TechniTrader.Courses
Charts do not predict what a stock will do. However, they are a necessary and highly useful tool when considering a stock to trade. Certain candlestick patterns will indicate that the giant Buy Side Institutions using Dark Pools are buying giant lots of the stock in an accumulation mode. They want to buy millions of shares of a stock to put into their portfolios to create the Mutual Funds in which individuals invest. However, as an example, they cannot buy 10 million shares of a stock all at one time. So, using Dark Pools, they buy the stock in increments over an extended period of time, and this creates a specific pattern on the chart.
When you see this pattern, it is time to buy the stock for a short-term trade because Dark Pools buying with Time Weighted Average Price (TWAP) orders creates an underlying energy. They are pulling so much liquidity aka stock from the market that it alerts Professional Traders and High Frequency Traders (HFTs), who quickly move the stock up in a fast momentum run.
Summary
When you understand why certain patterns form, who is controlling price, and how to calculate the best entry for the lowest risk, then trading becomes easy and fun.
Learning how to trade the Stock Market does require a solid Stock Market Education. If you want to be trading quickly for extra income or as a career, then you need to take a Stock Trading Course. If you want to try to learn this all on your own, be aware that most people spend 5–10 years attempting to do this and many thousands of dollars in “hard-learned lessons and losses” before they may get it right. That all adds up to a lot of wasted opportunity, time, and money.
There is a lot to learn, but you will find it fascinating, inspiring, and amazing. In learning how to trade stocks successfully by taking a course in Stock Market Education, you will be opening a door to a whole world that you had no idea existed.
LEARN MORE at TechniTrader.Courses
If you have not yet begun to trade or invest, go to Introduction: Learn How to Trade Stocks – Free Video Lesson to get started.
Learn the steps to trade like a pro with this introductory mini course. You will learn what it takes to create a Professional Trading Plan that can help you achieve your trading goals: How to Create a Professional Trading Plan
Trade Wisely,
Martha Stokes CMT
TechniTrader technical analysis using a FreeStockCharts chart, courtesy of Worden Bros. and FreeStockCharts.com
Chartered Market Technician
Instructor & Developer of TechniTrader Stock & Option Courses
Copyright ©2017–2025 Decisions Unlimited, Inc. dba TechniTrader. All rights reserved.
TechniTrader is also a registered trademark of Decisions Unlimited, Inc.